U.S. Census Bureau metropolitan population estimates July 1, 2018 –Release Date: April 18, 2019

Source: U.S. Census Bureau
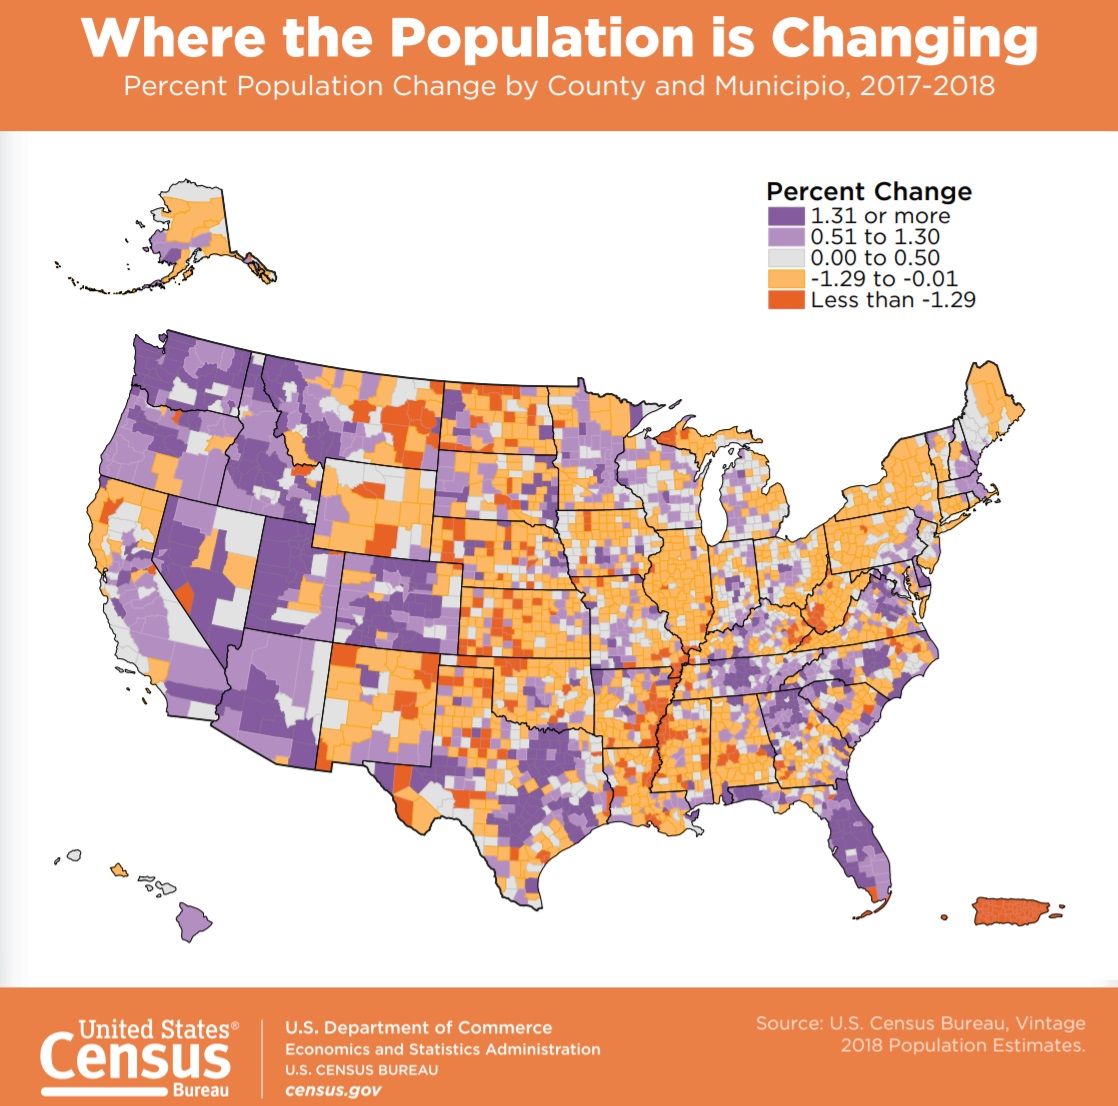
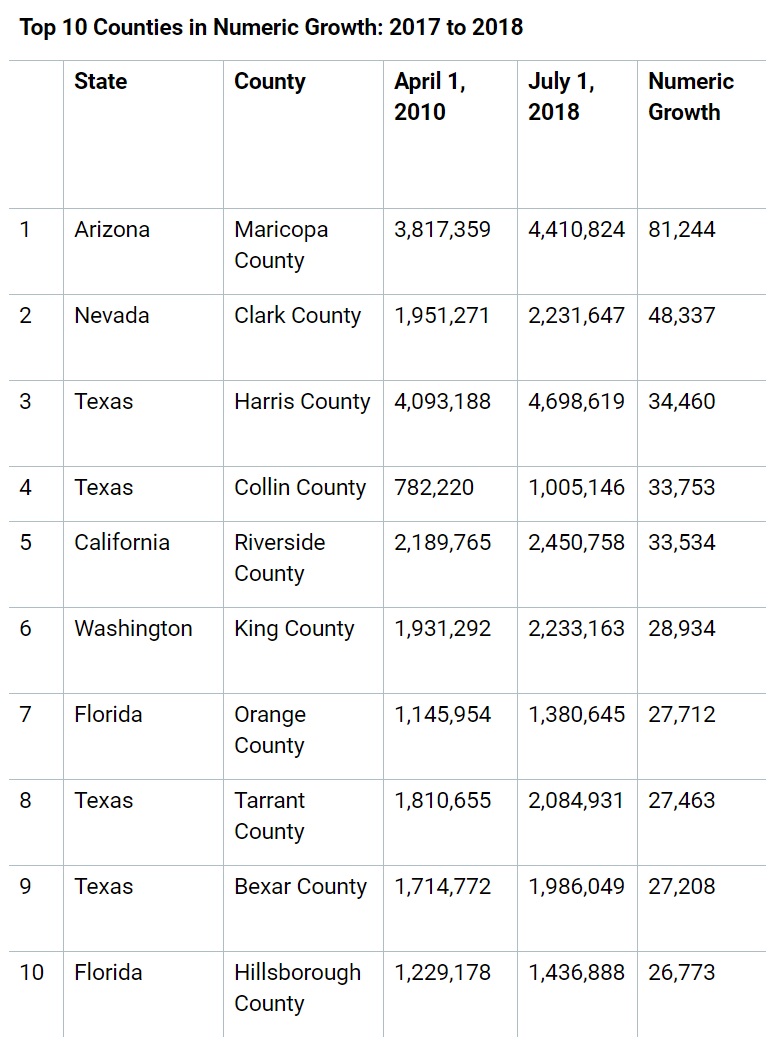
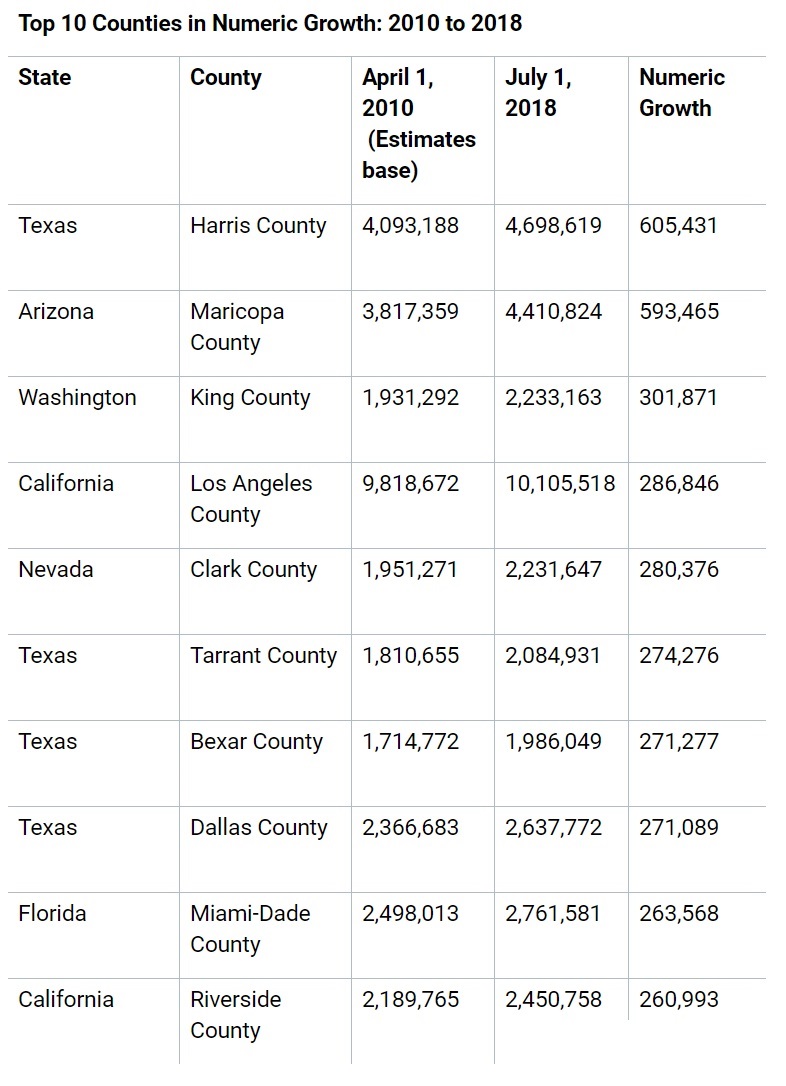
APRIL 18, 2019 — Counties with the largest numeric growth are all located in the south and the west, with counties in Texas taking four out of the top 10 spots according to new U.S. Census Bureau population estimates released April 18, 2019.
By metropolitan area, Dallas-Fort Worth-Arlington, Texas, had the largest numeric growth with a gain of 131,767 (1.8 percent) in 2018, followed by Phoenix-Mesa-Scottsdale, Ariz. with an increase of 96,268 (2.0 percent).
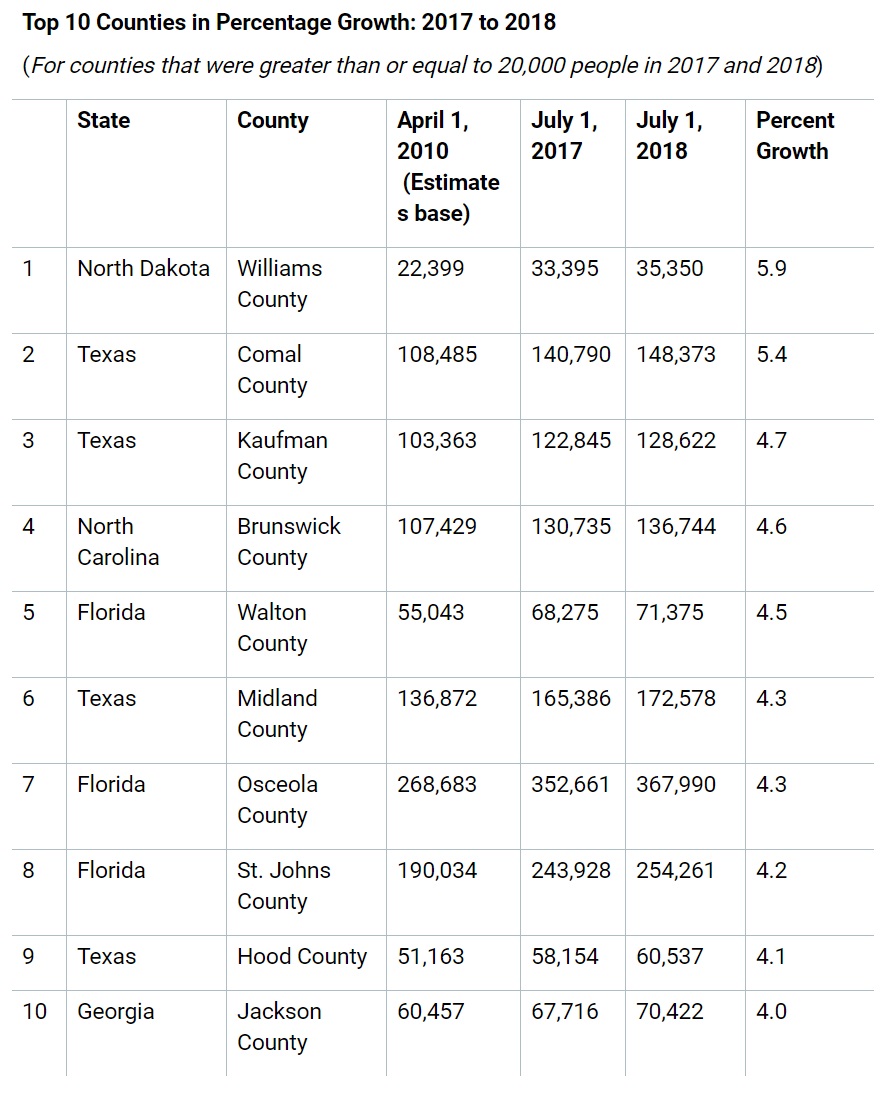
Among counties with a population of 20,000 or more, Williams County, N.D., was the fastest-growing county by percentage, increasing by 5.9 percent between 2017 and 2018 (from 33,395 to 35,350). The rapid growth Williams County, N.D., experienced was due mainly to net domestic migration (1,471) in 2018. The county also grew between 2017 and 2018 by natural increase (427) and international migration (52).
Of the other nine fastest-growing counties, all experienced positive domestic migration. All but Brunswick, N.C., and Hood, Texas, experienced growth through natural increase (having more births than deaths), and only Brunswick, N.C., had negative net international migration.
Annual Estimates of the Resident Population for Counties: April 1, 2010 to July 1, 2018
______
Populations of some of the largest U.S. metropolitan areas by Ranking July 1, 2018
Combined Statistical Area
| Metropolitan populations | 2010 Census | July 1, 2018 |
| New York-Newark, NY-NJ-CT-PA CSA | 23,076,664 | 23,522,861 |
| Los Angeles-Long Beach, CA CSA | 17,877,006 | 18,764,814 |
| Chicago-Naperville, IL-IN-WI CSA | 9,840,929 | 9,866,910 |
| Washington-Baltimore-Arlington, DC-MD-VA-WV-PA CSA | 9,051,961 | 9,797,063 |
| San Jose-San Francisco-Oakland, CA CSA | 8,153,696 | 8,841,475 |
| Boston-Worcester-Providence, MA-RI-NH-CT CSA | 7,893,376 | 8,285,407 |
| Dallas-Fort Worth, TX-OK CSA | 6,851,398 | 7,994,303 |
| Philadelphia-Reading-Camden, PA-NJ-DE-MD CSA | 7,067,807 | 7,204,035 |
| Houston-The Woodlands, TX CSA | 6,114,562 | 7,197,883 |
| Miami-Fort Lauderdale-Port St. Lucie, FL CSA | 6,166,766 | 6,879,772 |
| Atlanta–Athens-Clarke County–Sandy Springs, GA CSA | 5,910,296 | 6,630,231 |
| Detroit-Warren-Ann Arbor, MI CSA | 5,318,744 | 5,353,002 |
| Phoenix-Mesa-Scottsdale, AZ MSA | 4,192,887 | 4,857,962 |
| Seattle-Tacoma, WA CSA | 4,274,767 | 4,853,364 |
| Minneapolis-St. Paul, MN-WI CSA | 3,684,928 | 3,977,790 |
| Denver-Aurora, CO CSA | 3,090,874 | 3,572,798 |
| Cleveland-Akron-Canton, OH CSA | 3,515,646 | 3,483,297 |
| Orlando-Deltona-Daytona Beach, FL CSA | 2,818,120 | 3,361,321 |
| San Diego-Carlsbad, CA MSA | 3,095,313 | 3,343,364 |
| Portland-Vancouver-Salem, OR-WA CSA | 2,921,408 | 3,239,335 |
| Tampa-St. Petersburg-Clearwater, FL MSA | 2,783,243 | 3,142,663 |
| St. Louis-St. Charles-Farmington, MO-IL CSA | 2,892,497 | 2,909,777 |
| Charlotte-Concord, NC-SC CSA | 2,375,675 | 2,728,933 |
| Sacramento-Roseville, CA CSA | 2,414,783 | 2,619,754 |
| Pittsburgh-New Castle-Weirton, PA-OH-WV CSA | 2,660,727 | 2,612,492 |
| Salt Lake City-Provo-Orem, UT CSA | 2,271,696 | 2,606,548 |
| San Antonio-New Braunfels, TX MSA | 2,142,508 | 2,518,036 |
| Columbus-Marion-Zanesville, OH CSA | 2,308,509 | 2,509,850 |
| Kansas City-Overland Park-Kansas City, MO-KS CSA | 2,343,008 | 2,487,053 |
| Las Vegas-Henderson, NV-AZ CSA | 2,195,401 | 2,486,543 |
| Indianapolis-Carmel-Muncie, IN CSA | 2,266,569 | 2,431,361 |
| San Juan-Carolina, PR CSA | 2,664,889 | 2,297,591 |
| Cincinnati-Wilmington-Maysville, OH-KY-IN CSA | 2,174,110 | 2,249,416 |
| Raleigh-Durham-Chapel Hill, NC CSA | 1,912,729 | 2,238,315 |
| Austin-Round Rock, TX MSA | 1,716,289 | 2,168,316 |
| Nashville-Davidson–Murfreesboro, TN CSA | 1,788,434 | 2,057,416 |
| Milwaukee-Racine-Waukesha, WI CSA | 2,025,989 | 2,049,391 |
| Virginia Beach-Norfolk, VA-NC CSA | 1,779,243 | 1,833,136 |
| Greensboro–Winston-Salem–High Point, NC CSA | 1,589,200 | 1,677,551 |
| Jacksonville-St. Marys-Palatka, FL-GA CSA | 1,470,473 | 1,662,541 |
| Louisville/Jefferson County–Elizabethtown–Madison, KY-IN CSA | 1,459,911 | 1,528,738 |
| New Orleans-Metairie-Hammond, LA-MS CSA | 1,413,965 | 1,506,145 |
| Greenville-Spartanburg-Anderson, SC CSA | 1,362,073 | 1,478,658 |
| Hartford-West Hartford, CT CSA | 1,486,436 | 1,473,084 |
| Oklahoma City-Shawnee, OK CSA | 1,322,429 | 1,469,124 |
| Grand Rapids-Wyoming-Muskegon, MI CSA | 1,379,237 | 1,468,075 |
| Memphis-Forrest City, TN-MS-AR CSA | 1,353,087 | 1,376,059 |
| Birmingham-Hoover-Talladega, AL CSA | 1,343,899 | 1,366,283 |
| Richmond, VA MSA | 1,208,101 | 1,306,172 |
| Harrisburg-York-Lebanon, PA CSA | 1,219,422 | 1,267,057 |
| Buffalo-Cheektowaga, NY CSA | 1,215,826 | 1,206,992 |
| Albuquerque-Santa Fe-Las Vegas, NM CSA | 1,146,049 | 1,178,427 |
| Albany-Schenectady, NY CSA | 1,168,485 | 1,171,593 |
| Rochester-Batavia-Seneca Falls, NY CSA | 1,175,001 | 1,162,893 |
| Tulsa-Muskogee-Bartlesville, OK CSA | 1,106,431 | 1,162,677 |
| Fresno-Madera, CA CSA | 1,081,315 | 1,152,072 |
| Knoxville-Morristown-Sevierville, TN CSA | 1,077,073 | 1,135,556 |
| Cape Coral-Fort Myers-Naples, FL CSA | 940,274 | 1,133,098 |
| Tucson-Nogales, AZ CSA | 1,027,683 | 1,085,584 |
| Dayton-Springfield-Sidney, OH CSA | 1,080,044 | 1,079,837 |
| El Paso-Las Cruces, TX-NM CSA | 1,013,356 | 1,063,075 |
| North Port-Sarasota, FL CSA | 897,121 | 1,044,060 |
| Omaha-Council Bluffs-Fremont, NE-IA CSA | 902,041 | 978,989 |
| Chattanooga-Cleveland-Dalton, TN-GA-AL CSA | 923,460 | 966,466 |
| Columbia-Orangeburg-Newberry, SC CSA | 897,607 | 958,120 |
| McAllen-Edinburg, TX CSA | 835,737 | 930,464 |
| Little Rock-North Little Rock, AR CSA | 877,091 | 909,346 |
| Madison-Janesville-Beloit, WI CSA | 827,742 | 887,800 |
| Modesto-Merced, CA CSA | 770,246 | 824,580 |
| Des Moines-Ames-West Des Moines, IA CSA | 722,323 | 817,007 |
| Boise City-Mountain Home-Ontario, ID-OR CSA | 697,535 | 811,961 |
| Huntsville-Decatur-Albertville, AL CSA | 735,550 | 782,233 |
| Lexington-Fayette–Richmond–Frankfort, KY CSA | 687,173 | 746,330 |
| Spokane-Spokane Valley-Coeur d’Alene, WA-ID CSA | 666,247 | 734,998 |
| South Bend-Elkhart-Mishawaka, IN-MI CSA | 720,647 | 728,373 |
| Syracuse-Auburn, NY CSA | 742,603 | 727,647 |
| Springfield-Greenfield Town, MA CSA | 692,942 | 702,724 |
| Wichita-Arkansas City-Winfield, KS CSA | 667,230 | 680,106 |
| Charleston-Huntington-Ashland, WV-OH-KY CSA | 708,228 | 671,969 |
| Jackson-Vicksburg-Brookhaven, MS CSA | 660,368 | 669,549 |
| Toledo-Port Clinton, OH CSA | 651,429 | 643,640 |
| Portland-Lewiston-South Portland, ME CSA | 621,800 | 643,099 |
| Youngstown-Warren, OH-PA CSA | 673,614 | 641,617 |
| Fort Wayne-Huntington-Auburn, IN CSA | 611,712 | 634,851 |
| Mobile-Daphne-Fairhope, AL CSA | 595,257 | 631,779 |
| Reno-Carson City-Fernley, NV CSA | 579,668 | 629,453 |
| Lafayette-Opelousas-Morgan City, LA CSA | 604,784 | 621,902 |
| Visalia-Porterville-Hanford, CA CSA | 595,161 | 617,227 |
| Augusta-Richmond County, GA-SC MSA | 564,873 | 604,167 |
| Springfield-Branson, MO CSA | 520,589 | 554,579 |
| Fayetteville-Lumberton-Laurinburg, NC CSA | 536,708 | 553,735 |
| Lansing-East Lansing-Owosso, MI CSA | 534,684 | 550,085 |
| Savannah-Hinesville-Statesboro, GA CSA | 495,745 | 547,285 |
| Myrtle Beach-Conway, SC-NC CSA | 436,880 | 543,140 |
| Kalamazoo-Battle Creek-Portage, MI CSA | 524,030 | 535,848 |
| Pensacola-Ferry Pass, FL-AL CSA | 487,310 | 531,631 |
| Corpus Christi-Kingsville-Alice, TX CSA | 501,500 | 525,343 |
| Johnson City-Kingsport-Bristol, TN-VA CSA | 508,260 | 509,335 |
| Columbus-Auburn-Opelika, GA-AL CSA | 469,327 | 503,007 |
| Asheville-Brevard, NC CSA | 457,948 | 493,800 |
| Davenport-Moline, IA-IL CSA | 471,551 | 470,898 |
| Cedar Rapids-Iowa City, IA CSA | 410,526 | 445,696 |
| Brownsville-Harlingen-Raymondville, TX CSA | 428,354 | 445,423 |
| Rockford-Freeport-Rochelle, IL CSA | 450,639 | 433,334 |
| Macon-Bibb County–Warner Robins, GA CSA | 411,898 | 423,572 |
| Hickory-Lenoir, NC CSA | 410,493 | 413,923 |
| Tallahassee-Bainbridge, FL-GA CSA | 395,255 | 411,720 |
| Appleton-Oshkosh-Neenah, WI CSA | 392,660 | 408,544 |
| Peoria-Canton, IL CSA | 416,255 | 403,217 |
| Gulfport-Biloxi-Pascagoula, MS MSA | 370,702 | 397,261 |
| Saginaw-Midland-Bay City, MI CSA | 391,569 | 377,932 |
| Montgomery, AL MSA | 374,536 | 373,225 |
| Green Bay-Shawano, WI CSA | 352,422 | 367,045 |
| Gainesville-Lake City, FL CSA | 331,806 | 358,715 |
| Erie-Meadville, PA CSA | 369,331 | 357,124 |
| Lincoln-Beatrice, NE CSA | 324,468 | 356,083 |
| Lubbock-Levelland, TX CSA | 313,740 | 342,048 |
| Midland-Odessa, TX CSA | 278,801 | 340,455 |
| Springfield-Jacksonville-Lincoln, IL CSA | 316,177 | 308,124 |
| Wausau-Stevens Point-Wisconsin Rapids, WI CSA | 307,574 | 307,114 |
| Medford-Grants Pass, OR CSA | 285,919 | 306,957 |
| Rocky Mount-Wilson-Roanoke Rapids, NC CSA | 310,416 | 297,726 |
| Wilmington, NC MSA | 254,884 | 294,436 |
| Amarillo-Borger, TX CSA | 274,083 | 287,145 |
| Longview-Marshall, TX CSA | 280,000 | 286,143 |
| Tyler-Jacksonville, TX CSA | 260,559 | 282,813 |
| Fargo-Wahpeton, ND-MN CSA | 231,674 | 267,964 |
| Bloomsburg-Berwick-Sunbury, PA CSA | 264,739 | 260,104 |
| Rochester-Austin, MN CSA | 246,040 | 259,813 |
| Harrisonburg-Staunton-Waynesboro, VA CSA | 243,730 | 258,284 |
| Lafayette-West Lafayette-Frankfort, IN CSA | 235,013 | 254,078 |
| Monroe-Ruston-Bastrop, LA CSA | 251,155 | 249,399 |
| Dothan-Enterprise-Ozark, AL CSA | 245,838 | 249,110 |
| Idaho Falls-Rexburg-Blackfoot, ID CSA | 229,650 | 247,612 |
| Redding-Red Bluff, CA CSA | 240,686 | 243,956 |
| State College-DuBois, PA CSA | 235,632 | 242,193 |
| Lake Charles-Jennings, LA CSA | 231,201 | 241,662 |
| Bowling Green-Glasgow, KY CSA | 210,871 | 231,638 |
| Columbia-Moberly-Mexico, MO CSA | 213,585 | 230,241 |
| Greenville-Washington, NC CSA | 215,907 | 226,993 |
| Bloomington-Pontiac, IL CSA | 225,083 | 224,358 |
| Lima-Van Wert-Celina, OH CSA | 221,838 | 217,707 |
| Mansfield-Ashland-Bucyrus, OH CSA | 221,398 | 216,394 |
| Bend-Redmond-Prineville, OR CSA | 178,711 | 215,863 |
| Pueblo-Cañon City, CO CSA | 205,887 | 215,550 |
| Eau Claire-Menomonie, WI CSA | 205,008 | 213,800 |
| Bloomington-Bedford, IN CSA | 205,683 | 213,430 |
| Joplin-Miami, MO-OK CSA | 207,366 | 210,077 |
| Johnstown-Somerset, PA CSA | 221,421 | 205,682 |
| Morgantown-Fairmont, WV CSA | 186,127 | 196,356 |
| New Bern-Morehead City, NC CSA | 193,271 | 194,743 |
| Sioux City-Vermillion, IA-SD-NE CSA | 182,427 | 183,086 |
| Elmira-Corning, NY CSA | 187,820 | 180,050 |
| Jonesboro-Paragould, AR CSA | 163,116 | 177,857 |
| Rapid City-Spearfish, SD CSA | 158,695 | 174,490 |
| Williamsport-Lock Haven, PA CSA | 155,349 | 152,348 |
| Ithaca-Cortland, NY CSA | 150,900 | 150,616 |
| Parkersburg-Marietta-Vienna, WV-OH CSA | 154,451 | 150,188 |
| Jackson-Brownsville, TN CSA | 148,798 | 146,544 |
| Cape Girardeau-Sikeston, MO-IL CSA | 135,466 | 135,440 |
| Paducah-Mayfield, KY-IL CSA | 135,883 | 133,964 |
| Hot Springs-Malvern, AR CSA | 128,947 | 132,855 |
| Edwards-Glenwood Springs, CO CSA | 125,734 | 132,713 |
| Findlay-Tiffin, OH CSA | 131,527 | 131,137 |
| Manhattan-Junction City, KS CSA | 127,081 | 130,574 |
| Mankato-New Ulm-North Mankato, MN CSA | 122,633 | 126,758 |
| Rome-Summerville, GA CSA | 122,332 | 122,717 |
| Victoria-Port Lavaca, TX CSA | 115,384 | 121,180 |
| Kokomo-Peru, IN CSA | 119,655 | 117,933 |
| Moses Lake-Othello, WA CSA | 107,848 | 117,090 |
| Quincy-Hannibal, IL-MO CSA | 116,262 | 114,350 |
| Mount Pleasant-Alma, MI CSA | 112,787 | 111,161 |
| Pullman-Moscow, WA-ID CSA | 82,020 | 89,925 |
| Dixon-Sterling, IL CSA | 94,529 | 89,849 |
| Richmond-Connersville, IN CSA | 93,194 | 88,983 |
| DeRidder-Fort Polk South, LA CSA | 87,988 | 86,113 |
| Columbus-West Point, MS CSA | 80,413 | 78,316 |
| Martin-Union City, TN-KY CSA | 73,641 | 69,802 |
| Clovis-Portales, NM CSA | 68,222 | 68,180 |
| Cleveland-Indianola, MS CSA | 63,595 | 57,068 |
| Oskaloosa-Pella, IA CSA | 55,690 | 55,407 |
| Steamboat Springs-Craig, CO CSA | 37,304 | 38,921 |
______
Some of the most populous counties by their July 1, 2018 populations
ALABAMA
Jefferson 659,300
Mobile 413,757
Madison 366,519
Montgomery 225,763
Shelby 215,707
Tuscaloosa 208,911
Baldwin 218,022
ALASKA
Anchorage Municipality 291,538
Matanuska-Susitna Borough 107,610
Fairbanks North Star Borough 98,971
ARIZONA
Maricopa 4,410,824
Pima 1,039,073
Pinal 447,138
Yavapai 231,993
Yuma 212,128
ARKANSAS
Pulaski 392,680
Benton 272,608
Washington 236,961
CALIFORNIA
Los Angeles 10,105,518
San Diego 3,343,364
Orange 3,185,968
Riverside 2,450,758
San Bernardino 2,171,603
Santa Clara 1,937,570
Alameda 1,666,753
Sacramento 1,540,975
Contra Costa 1,150,215
Fresno 994,400
COLORADO
Denver 716,492
El Paso 713,856
Arapahoe 651,215
Jefferson 580,233
Adams 511,868
Larimer 350,518
Douglas 342,776
Boulder 326,078
CONNECTICUT
Fairfield 943,823
Hartford 892,697
New Haven 857,620
DELAWARE
New Castle 559,335
Sussex 229,286
DISTRICT OF COLUMBIA
Washington 702,455
FLORIDA
Miami-Dade 2,761,581
Broward 1,951,260
Palm Beach 1,485,941
Hillsborough 1,436,888
Orange 1,380,645
Pinellas 975,280
Duval 950,181
Lee 754,610
Polk 708,009
GEORGIA
Fulton 1,050,114
Gwinnett 927,781
Cobb 756,865
DeKalb 756,558
Chatham 289,195
Clayton 289,615
Cherokee 254,149
Henry 230,220
Forsyth 236,612
Richmond 201,554
Muscogee 194,160
HAWAII
Honolulu 980,080
Hawaii 200,983
IDAHO
Ada 469,966
Canyon 223,499
Kootenai 161,505
Bonneville 116,854
ILLINOIS
Cook 5,180,493
DuPage 928,589
Lake 700,832
Will 692,310
Kane 534,216
INDIANA
Marion 954,670
Lake 484,411
Allen 375,351
Hamilton 330,086
IOWA
Polk 487,204
Linn 225,909
Scott 173,283
Johnson 151,260
Black Hawk 132,408
Woodbury 102,539
KANSAS
Johnson 597,555
Sedgwick 513,607
Shawnee 177,499
Wyandotte 165,324
Douglas 121,436
KENTUCKY
Jefferson 770,517
Fayette 323,780
Kenton 166,051
LOUISIANA
East Baton Rouge 440,956
Jefferson 434,051
Orleans 391,006
Caddo 242,922
St. Tammany 258,111
Lafayette 242,782
MAINE
Cumberland 293,557
York 206,229
Penobscot 151,096
Kennebec 122,083
MARYLAND
Montgomery 1,052,567
Baltimore County (excluding Baltimore City) 828,431
Baltimore City 602,495
Anne Arundel 576,031
Howard 323,196
MASSACHUSETTS
Middlesex 1,614,714
Worcester 830,839
Suffolk 807,252
Essex 790,638
MICHIGAN
Wayne 1,753,893
Oakland 1,259,201
Macomb 874,759
Kent 653,786
Genesee 406,892
MINNESOTA
Hennepin 1,259,428
Ramsey 550,210
Dakota 425,423
Anoka 353,813
MISSISSIPPI
Hinds 237,085
Harrison 206,650
DeSoto 182,001
Rankin 153,902
Jackson 143,277
MISSOURI
St. Louis (not including City of St. Louis) 996,945
Jackson 700,307
St. Charles 399,182
St. Louis city 302,838
Greene 291,923
Clay 246,365
Jefferson 224,347
MONTANA
Yellowstone 160,137
Missoula 118,791
NEBRASKA
Douglas 566,880
Lancaster 317,272
Sarpy 184,459
NEVADA
Clark 2,231,647
Washoe 465,735
NEW HAMPSHIRE
Hillsborough 415,247
Rockingham 309,176
Merrimack 151,132
NEW JERSEY
Bergen 936,692
Middlesex 829,685
Essex 799,767
Hudson 676,061
Monmouth 621,354
Ocean 601,651
Union 558,067
NEW MEXICO
Bernalillo 678,701
Doña Ana 217,522
Santa Fe 150,056
Sandoval 145,179
San Juan 125,04
NEW YORK
Kings 2,582,830
Queens 2,278,906
New York 1,628,701
Suffolk 1,481,093
Bronx 1,432,132
Nassau 1,358,343
Westchester 967,612
Erie 919,719
Monroe 742,474
Richmond 476,179
Onondaga 461,809
NORTH CAROLINA
Mecklenburg 1,093,901
Wake 1,092,305
Guilford 533,670
Forsyth 379,099
Cumberland 332,330
Durham 316,739
Buncombe 259,103
Union 235,908
New Hanover 232,274
Gaston 222,846
Johnston 202,675
Onslow 197,683
Pitt 179,914
Iredell 178,435
Davidson 166,614
Alamance 166,436
Catawba 158,652
Orange 146,027
Randolph 143,351
Rowan 141,262
Harnett 134,214
NORTH DAKOTA
Cass 181,516
Burleigh 95,273
Grand Forks 70,770
Ward 67,744
OHIO
Franklin 1,310,300
Cuyahoga 1,243,857
Hamilton 816,684
Summit 541,918
Montgomery 532,331
Lucas 429,899
Stark 371,574
Butler 382,378
Lorain 309,461
OKLAHOMA
Oklahoma 792,582
Tulsa 648,360
Cleveland 281,669
OREGON
Multnomah 811,880
Washington 597,695
Clackamas 416,075
Lane 379,611
Marion 346,868
PENNSYLVANIA
Philadelphia (and the City of Philadelphia) 1,584,138
Allegheny 1,218,452
Montgomery 828,604
Bucks 628,195
Delaware 564,751
Lancaster 543,557
Chester 522,046
York 448,273
Berks 420,152
RHODE ISLAND
Providence 636,084
SOUTH CAROLINA
Greenville 514,213
Charleston 405,905
Horry 344,147
Spartanburg 313,888
Lexington 295,032
York 274,118
Berkeley 221,091
Anderson 200,482
SOUTH DAKOTA
Minnehaha 192,876
Pennington 111,729
TENNESSEE
Shelby 935,764
Davidson 692,587
Knox 465,289
Hamilton 364,286
Rutherford 324,890
TEXAS
Harris 4,698,619
Dallas 2,637,772
Tarrant 2,084,931
Bexar 1,986,049
Travis 1,248,743
Collin 1,005,146
Hidalgo 865,939
Denton 859,064
El Paso 840,758
Fort Bend 787,858
UTAH
Salt Lake 1,152,633
Utah 622,213
Davis 351,713
VERMONT
Chittenden 164,572
VIRGINIA
Fairfax 1,150,795
Virginia Beach city 450,189
Prince William 468,011
Loudoun 406,850
Chesterfield 348,556
Henrico 329,261
Norfolk city 244,076
Chesapeake city 242,634
Arlington 237,521
Richmond city 228,783
WASHINGTON
King 2,233,163
Pierce 891,299
Snohomish 814,901
Spokane 514,631
Clark 481,857
WEST VIRGINIA
Kanawha 180,454
Berkeley 117,123
Monongalia 106,420
WISCONSIN
Milwaukee 948,201
Dane 542,364
Waukesha 403,072
Brown 263,378
WYOMING
Laramie 98,976
Natrona 79,115
___
Metro maps showing counties that comprise some of the Combined Statistical Areas (CSA)

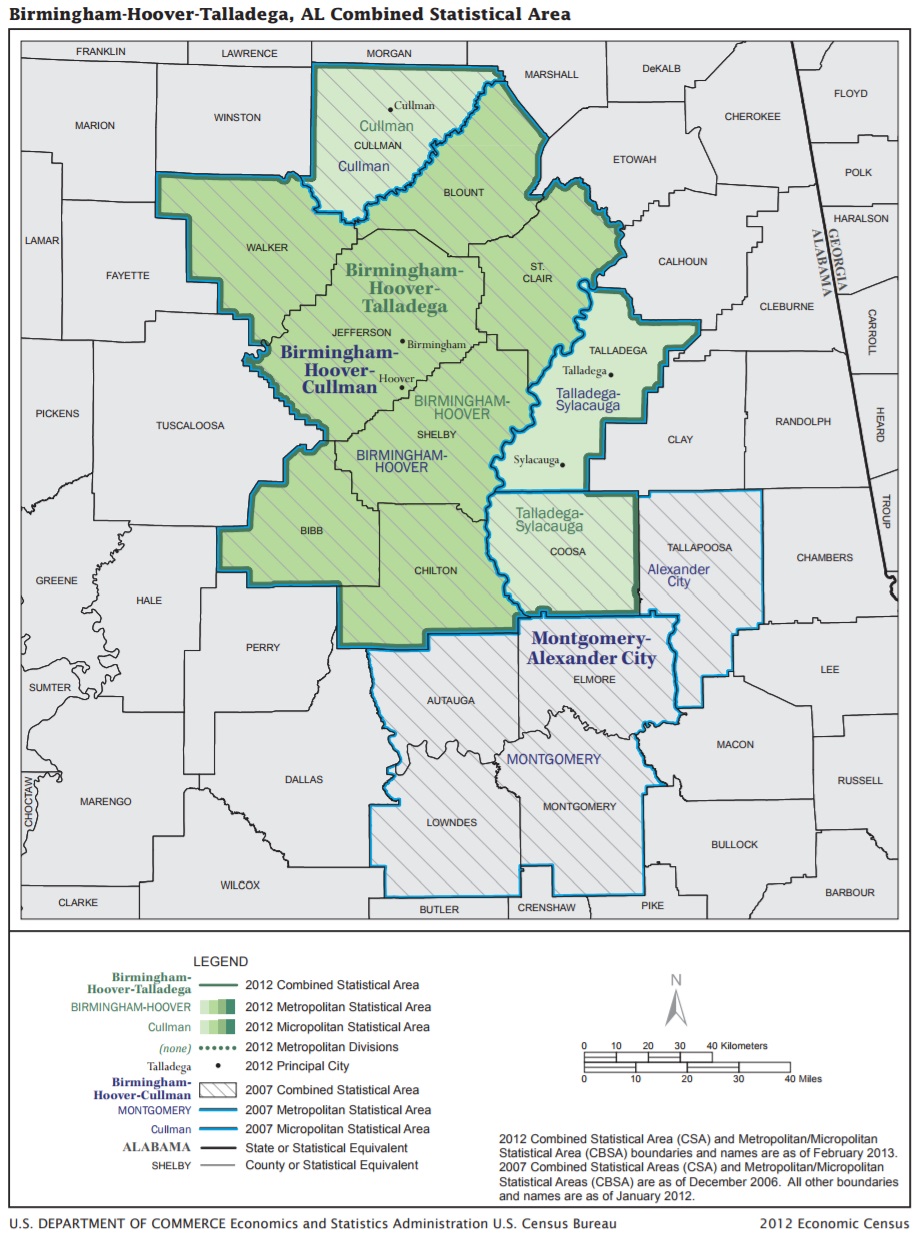


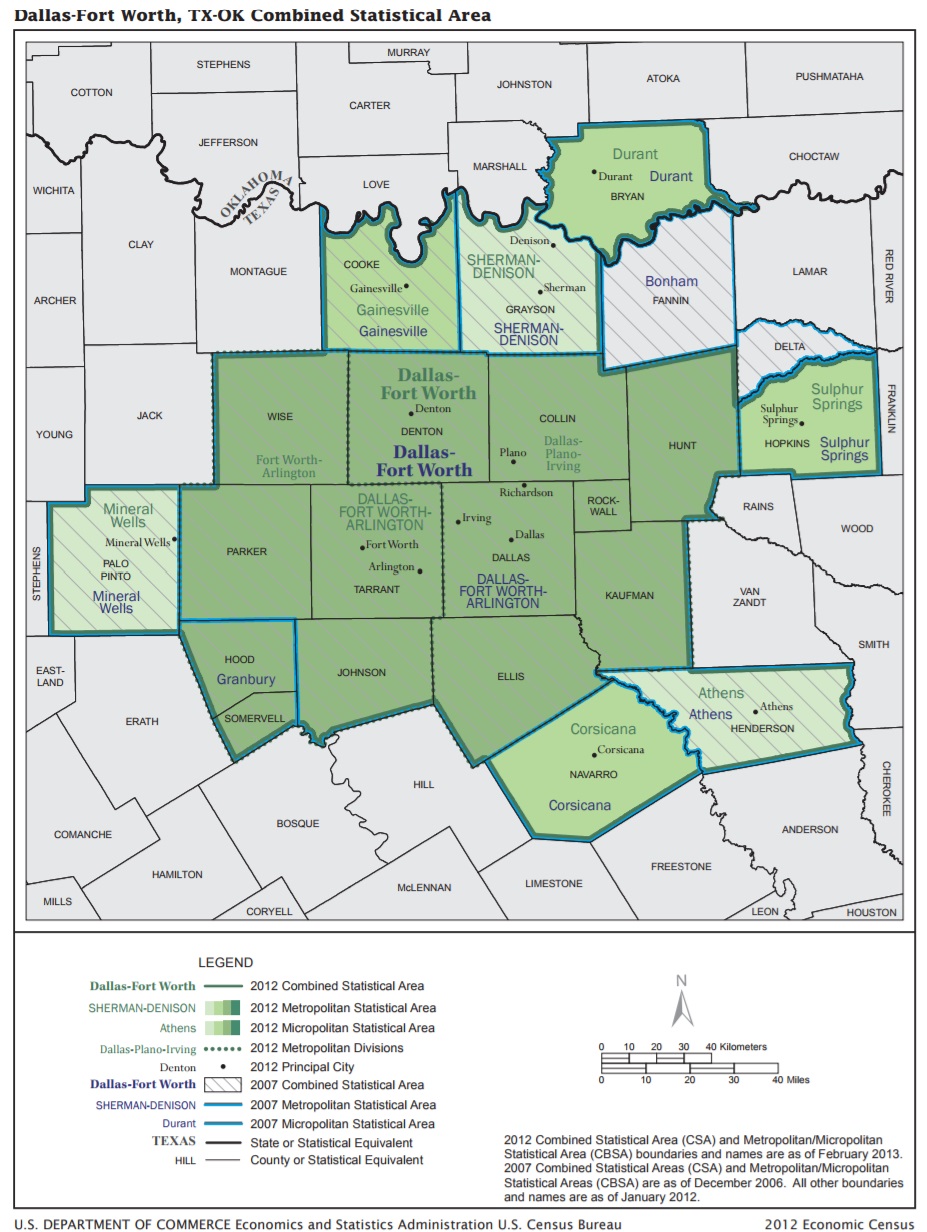
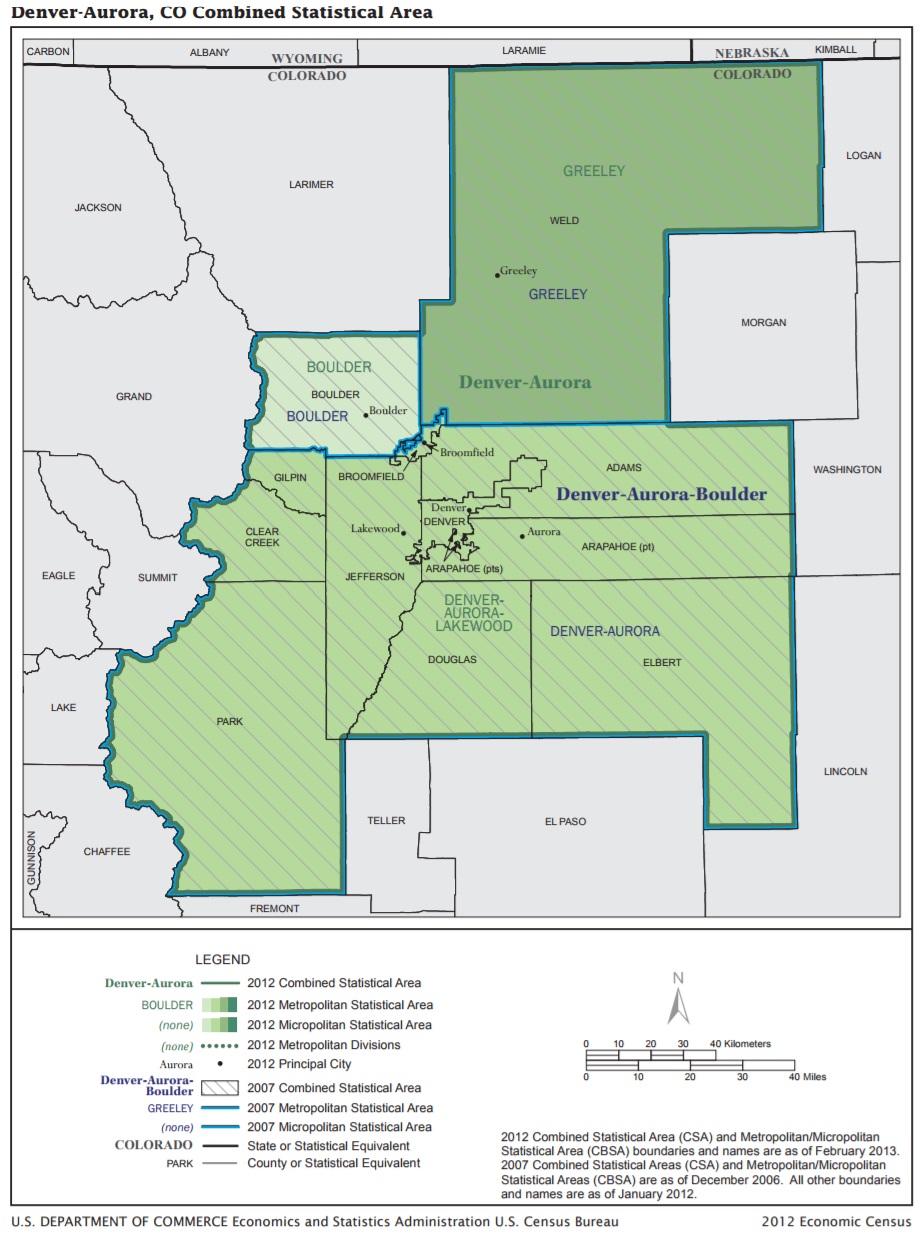


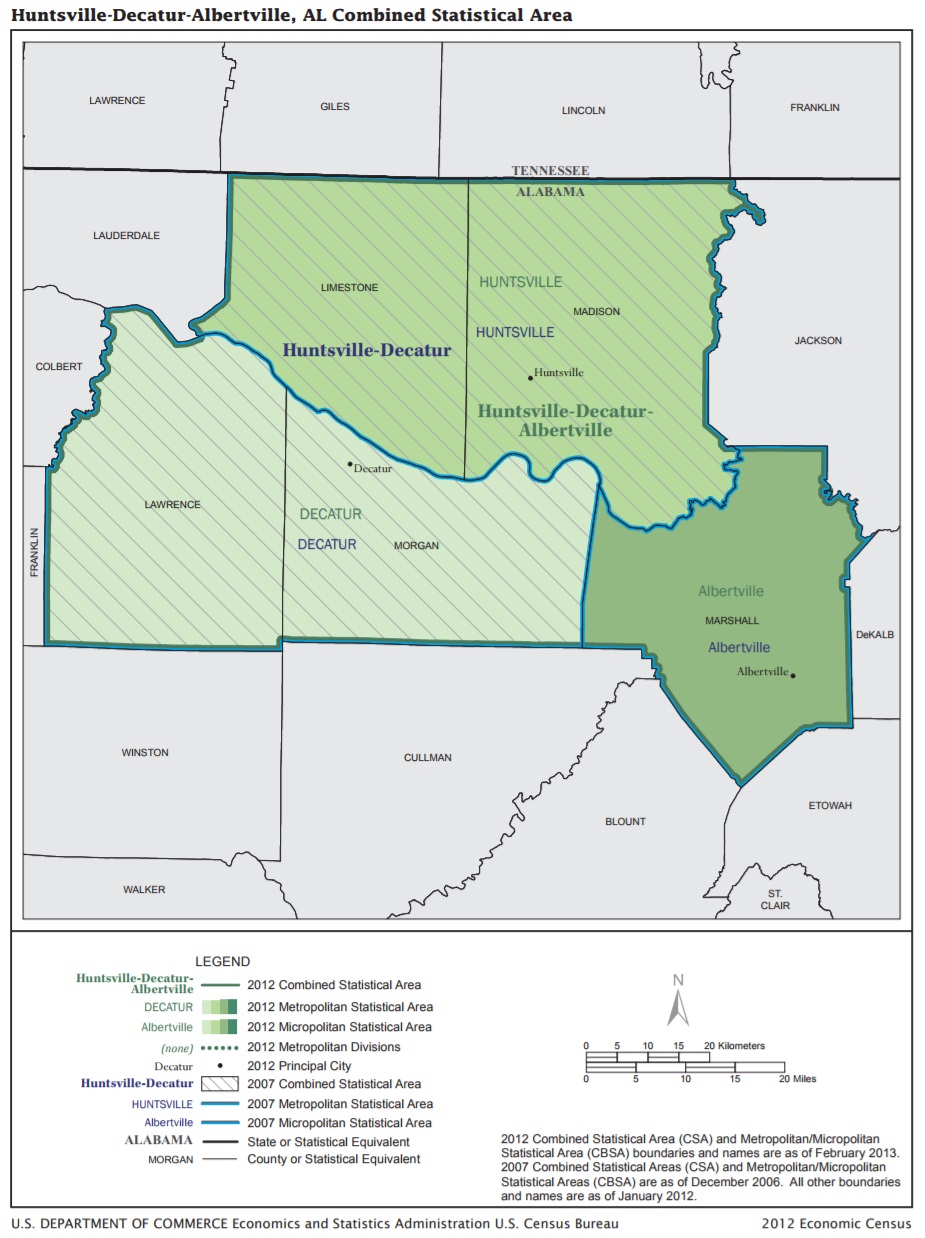

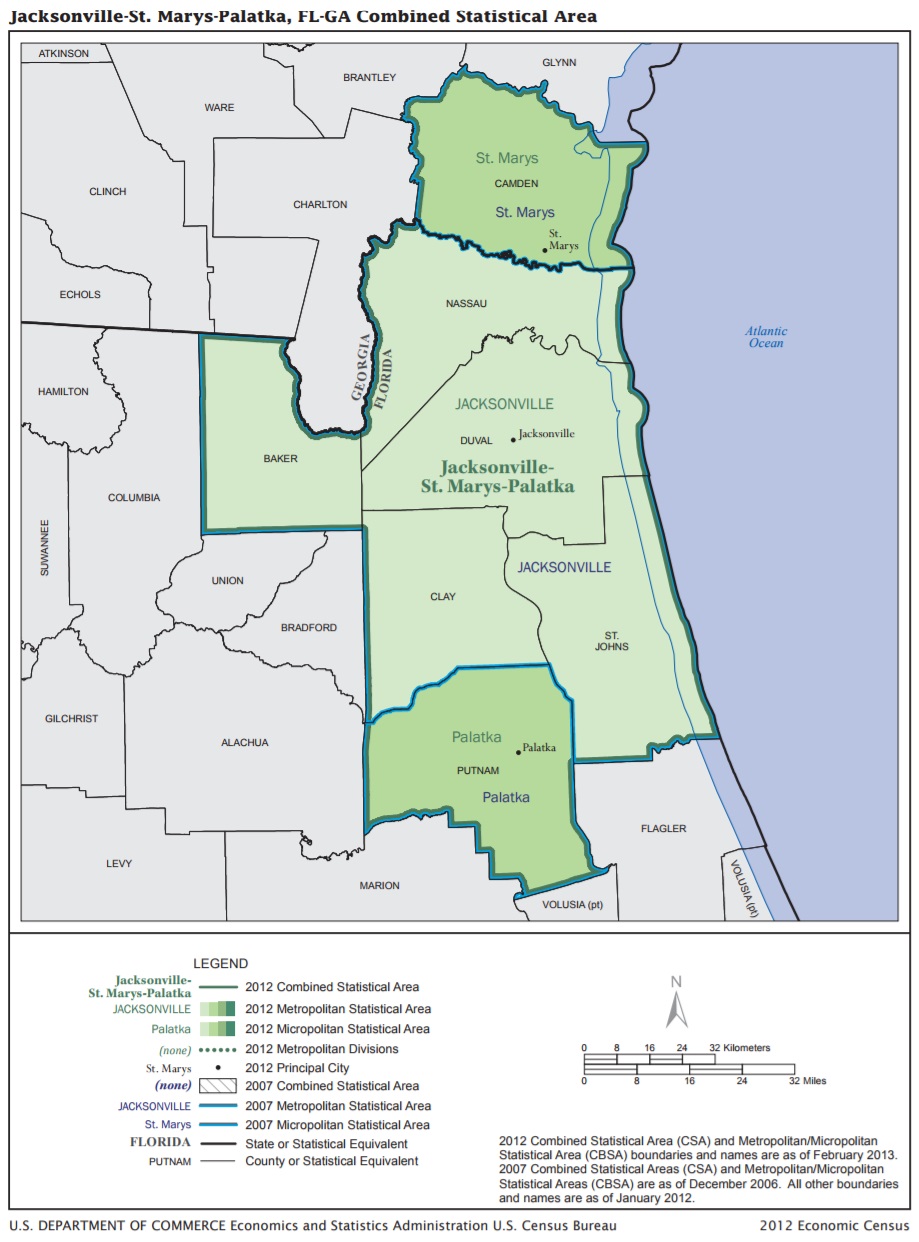
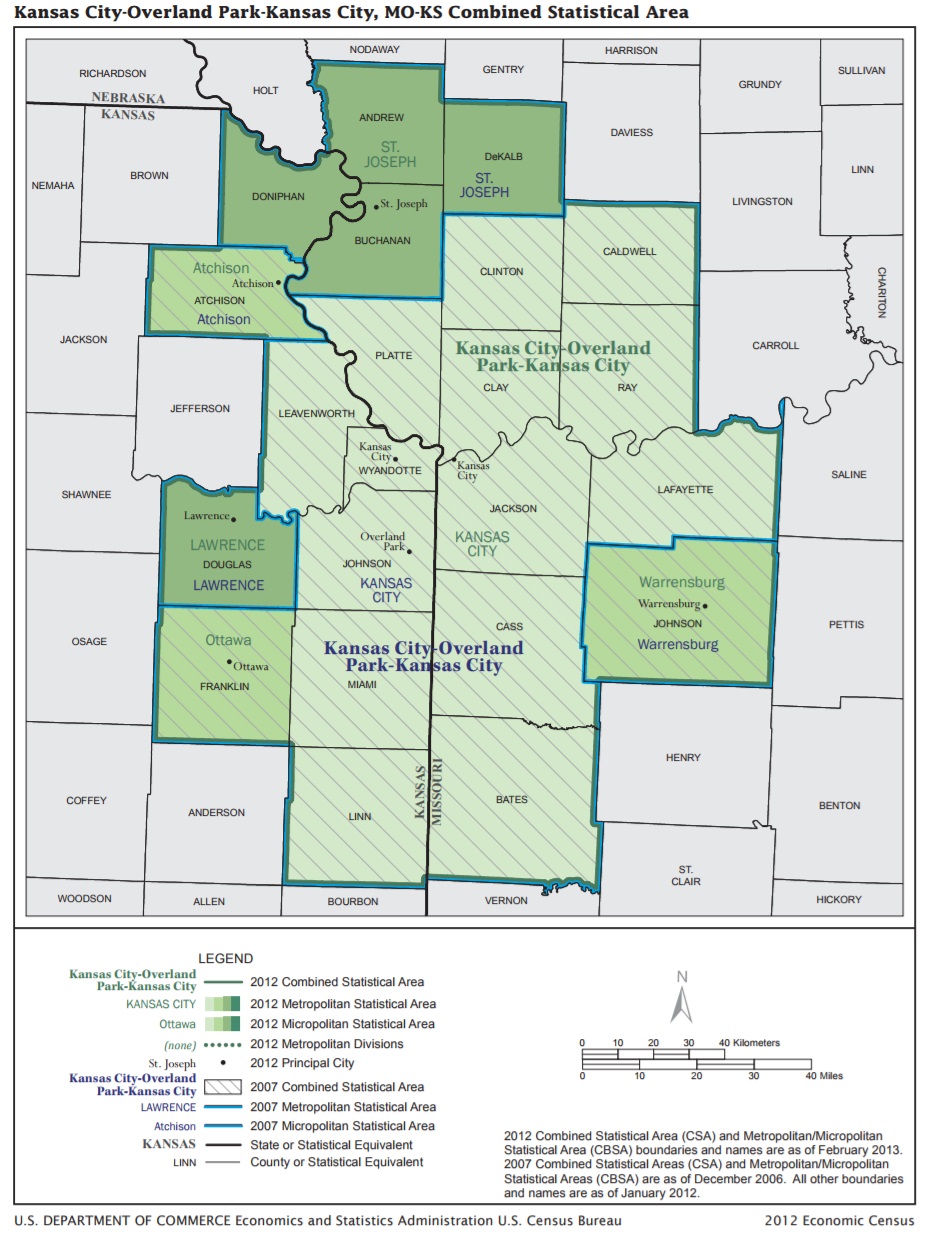
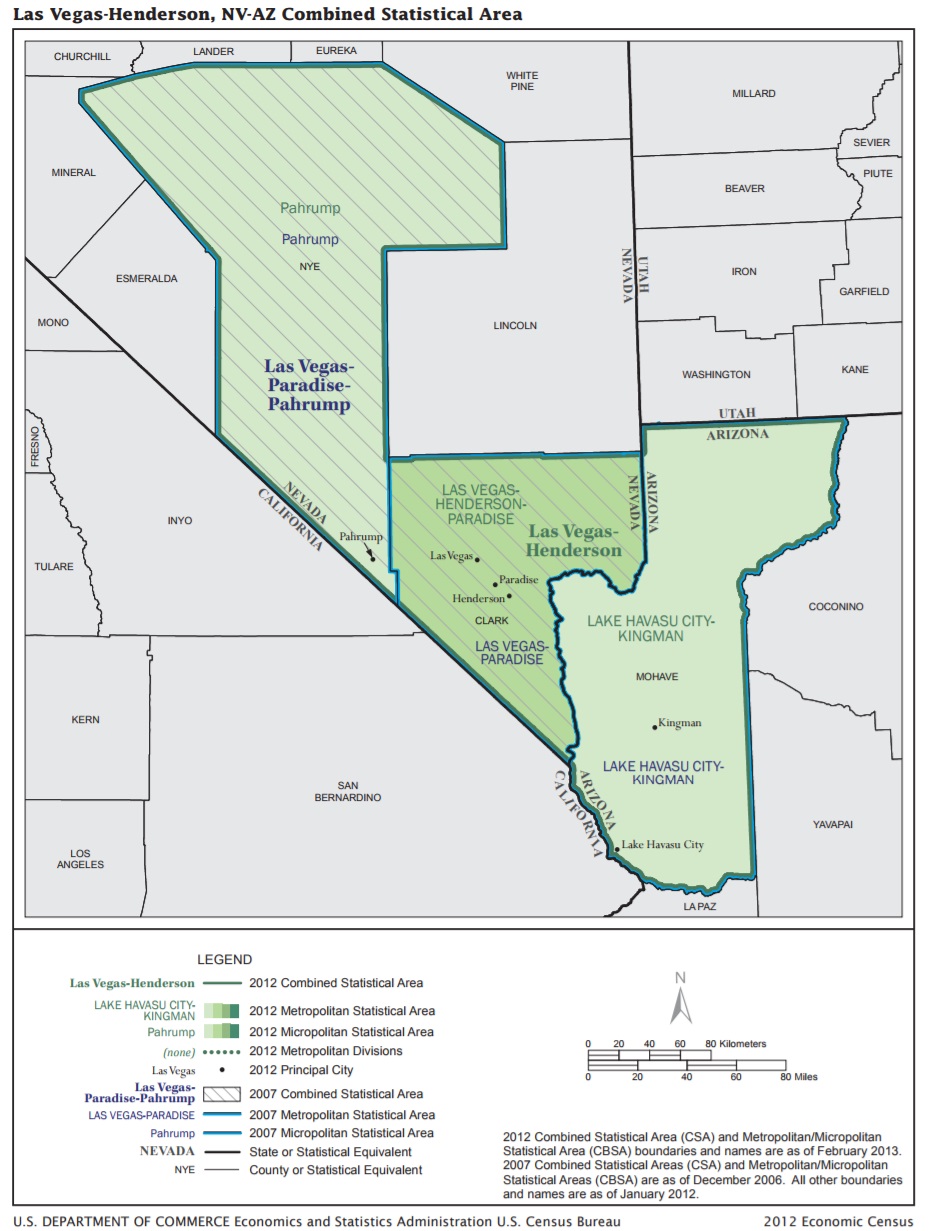


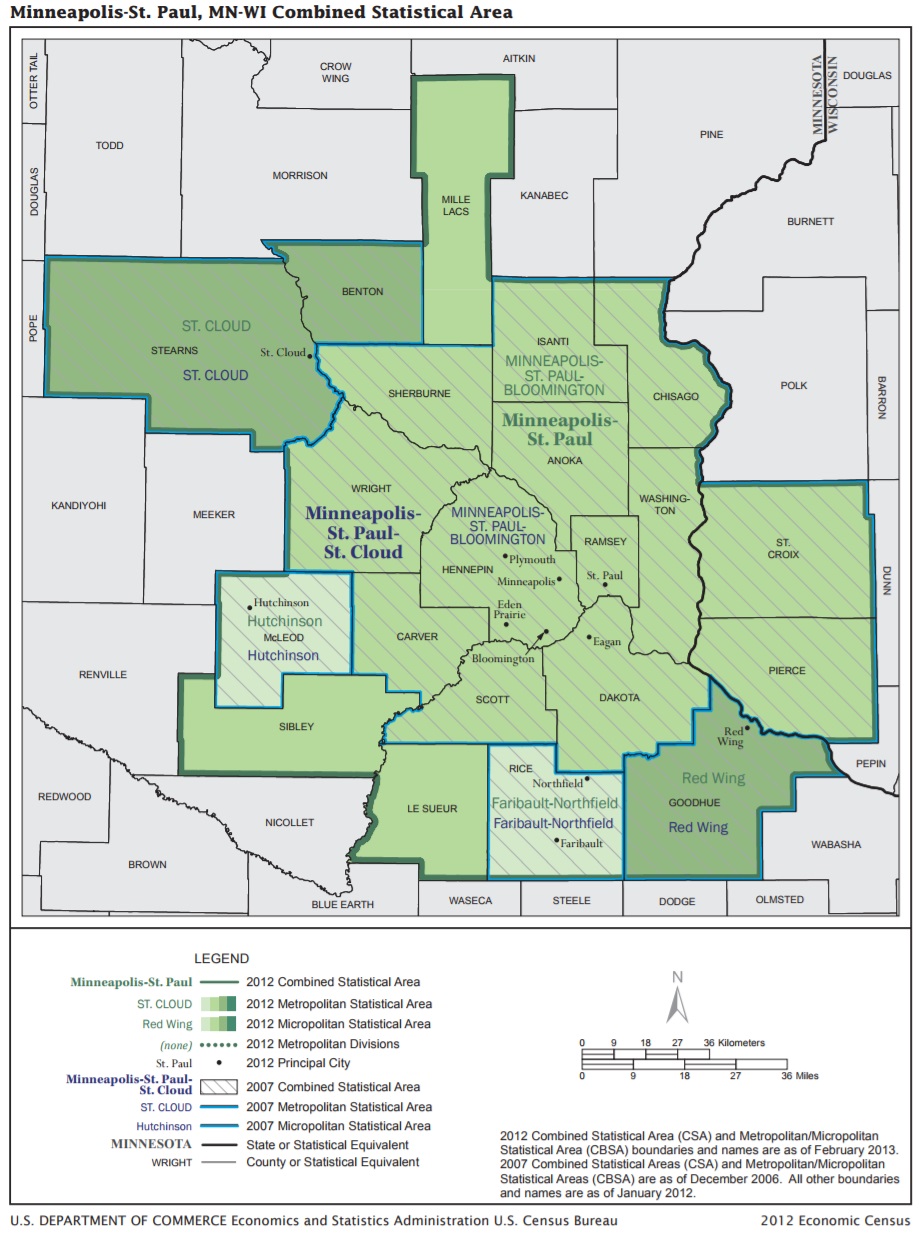
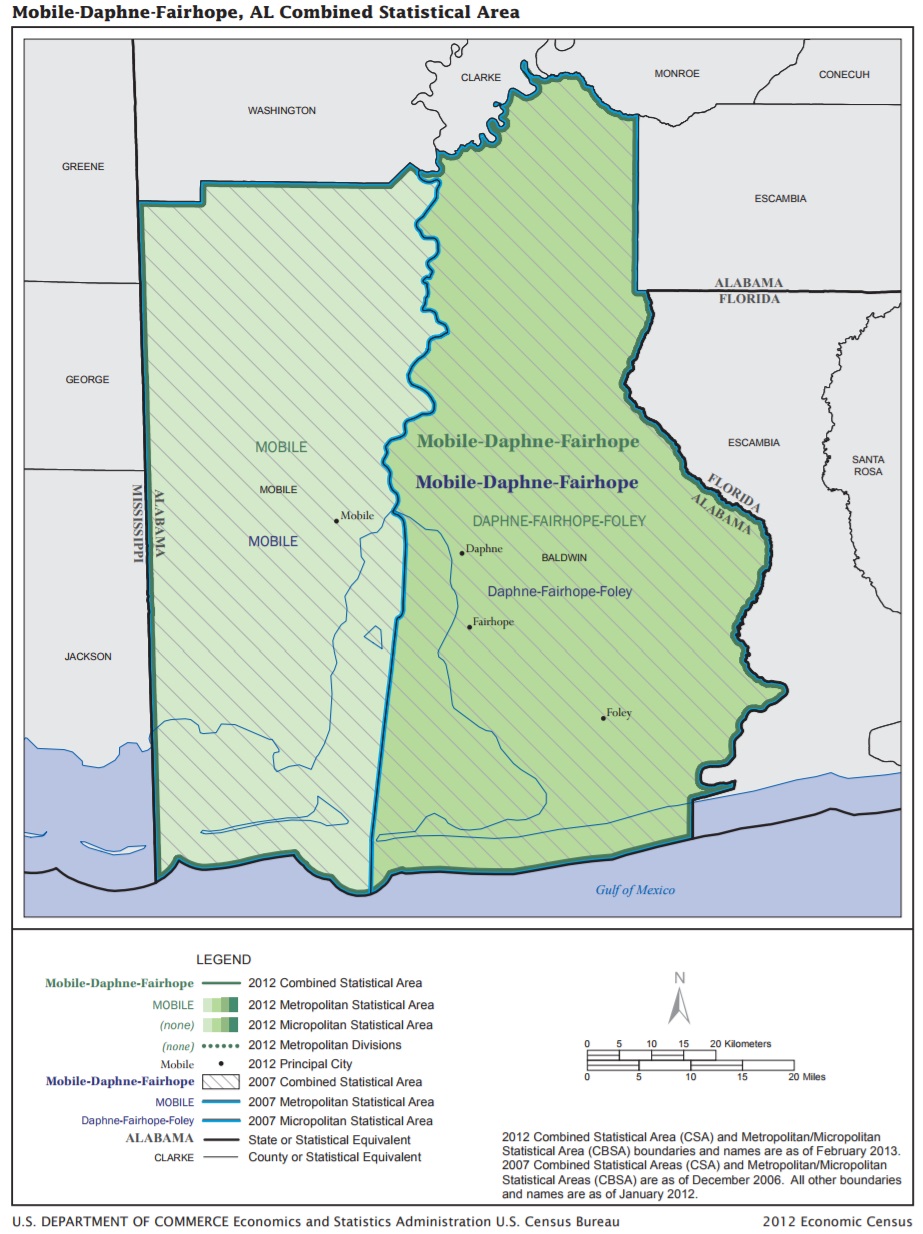

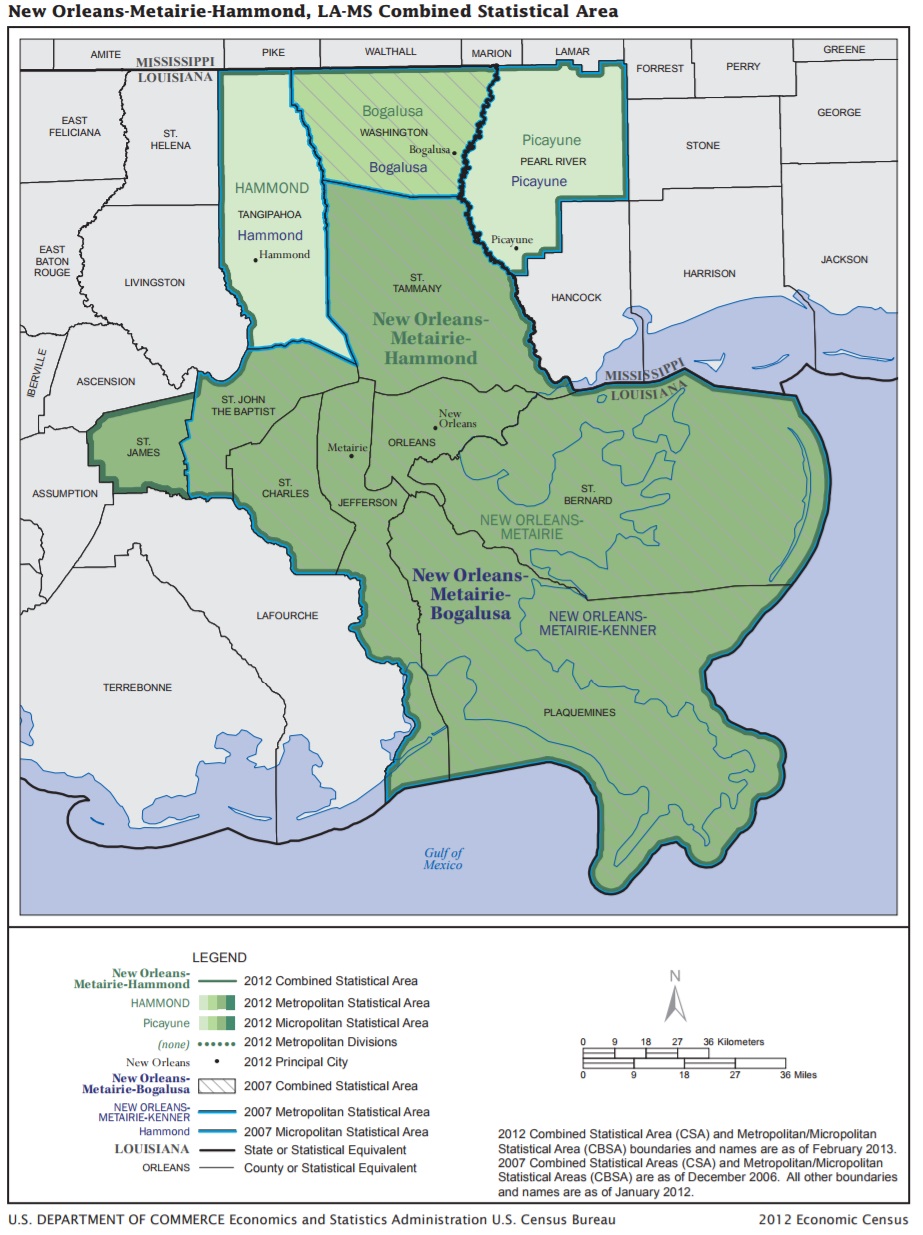


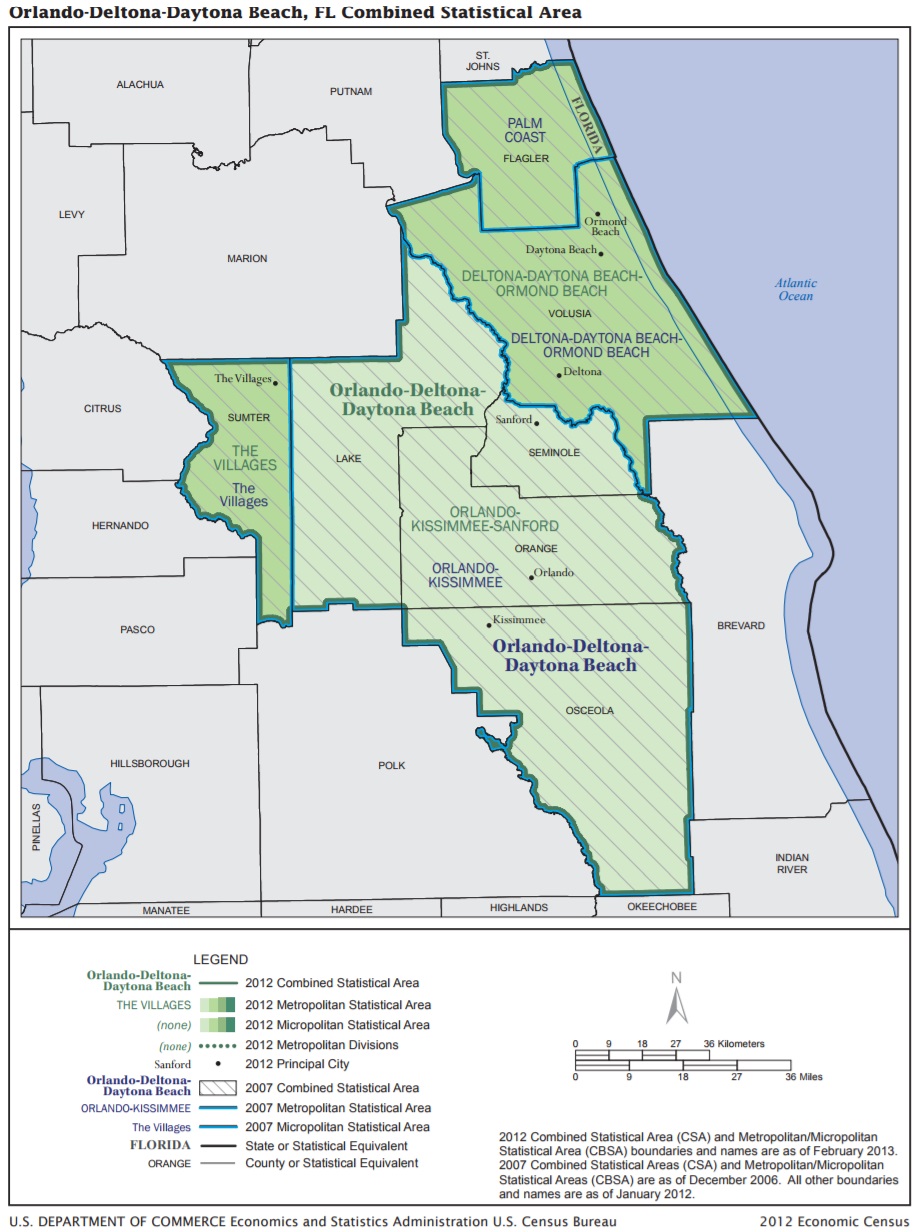

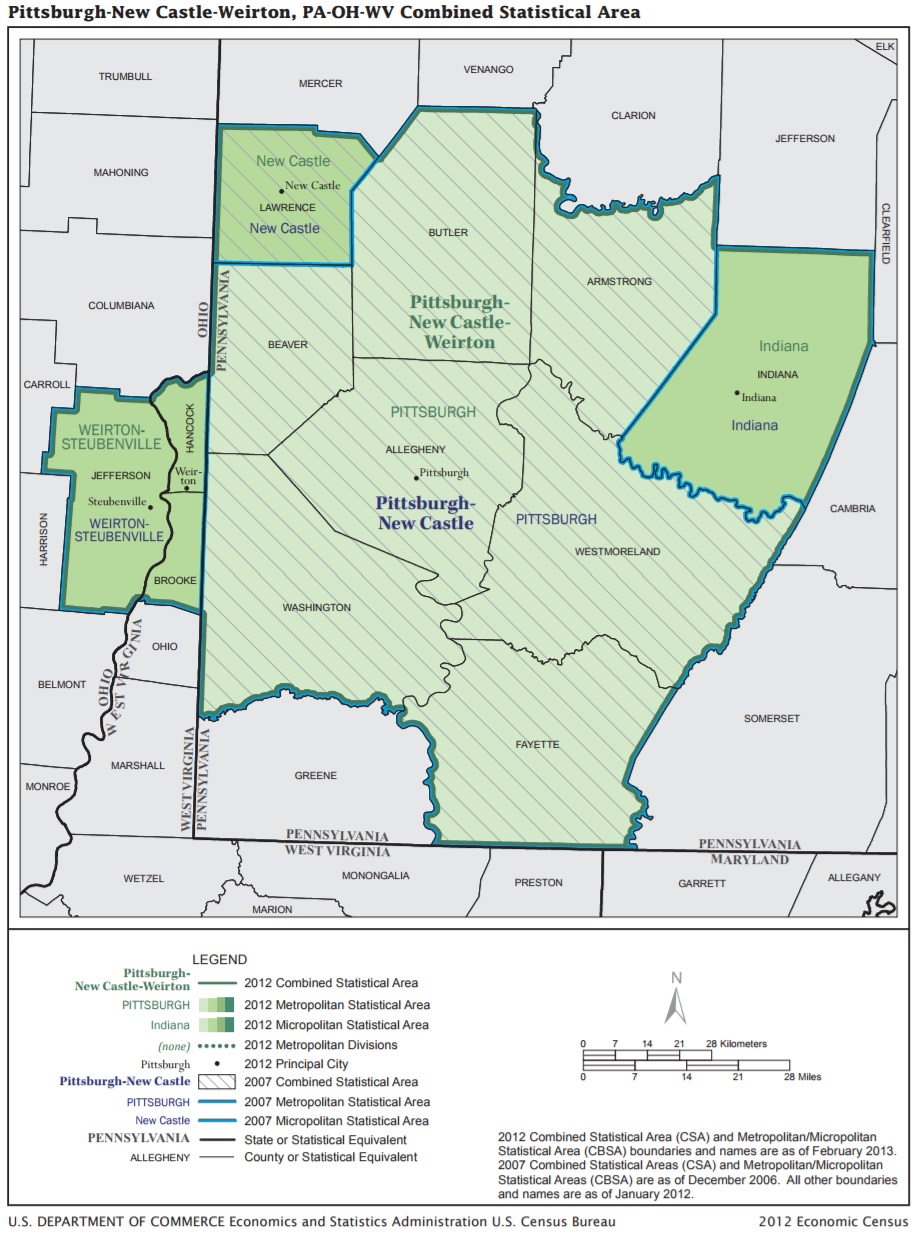


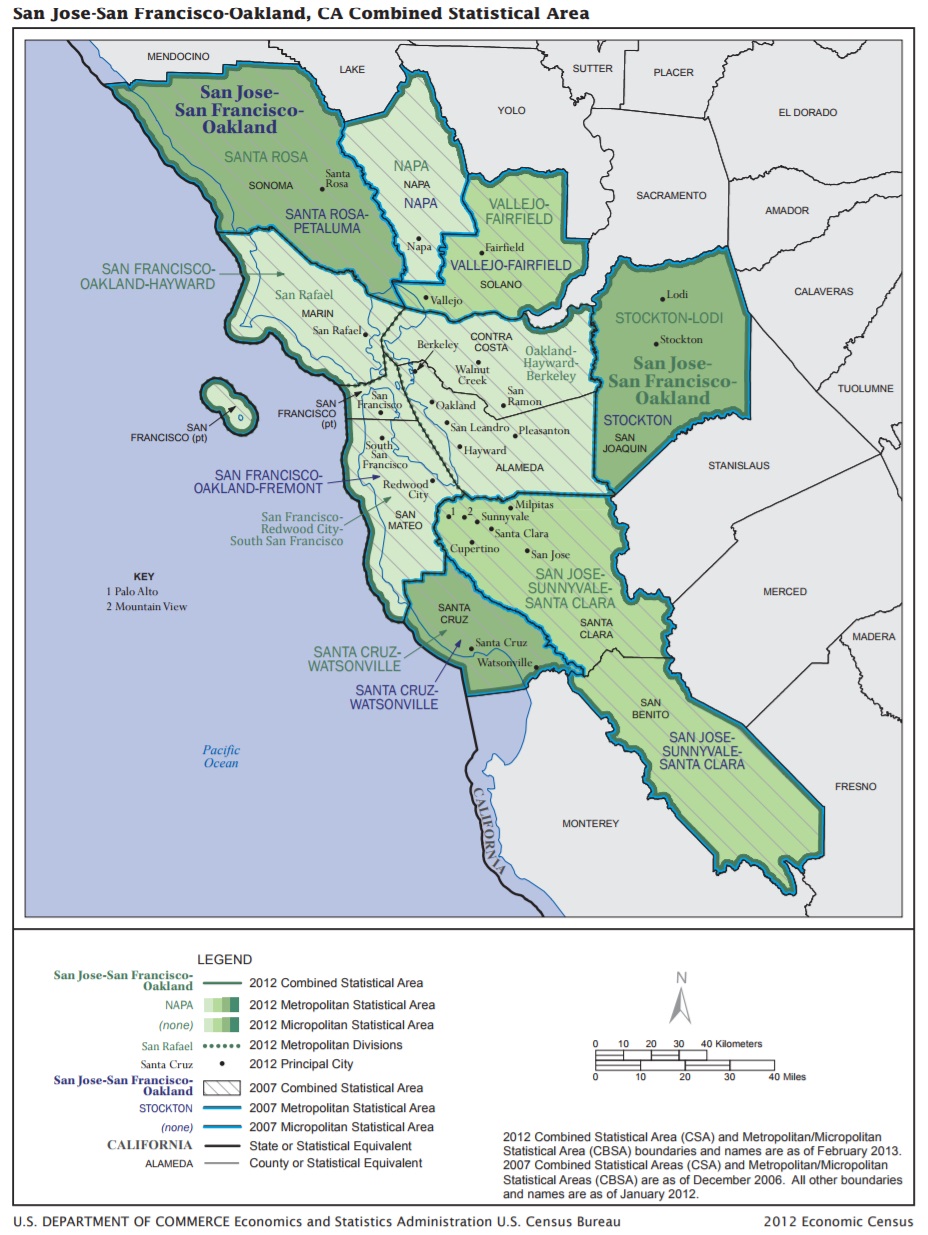


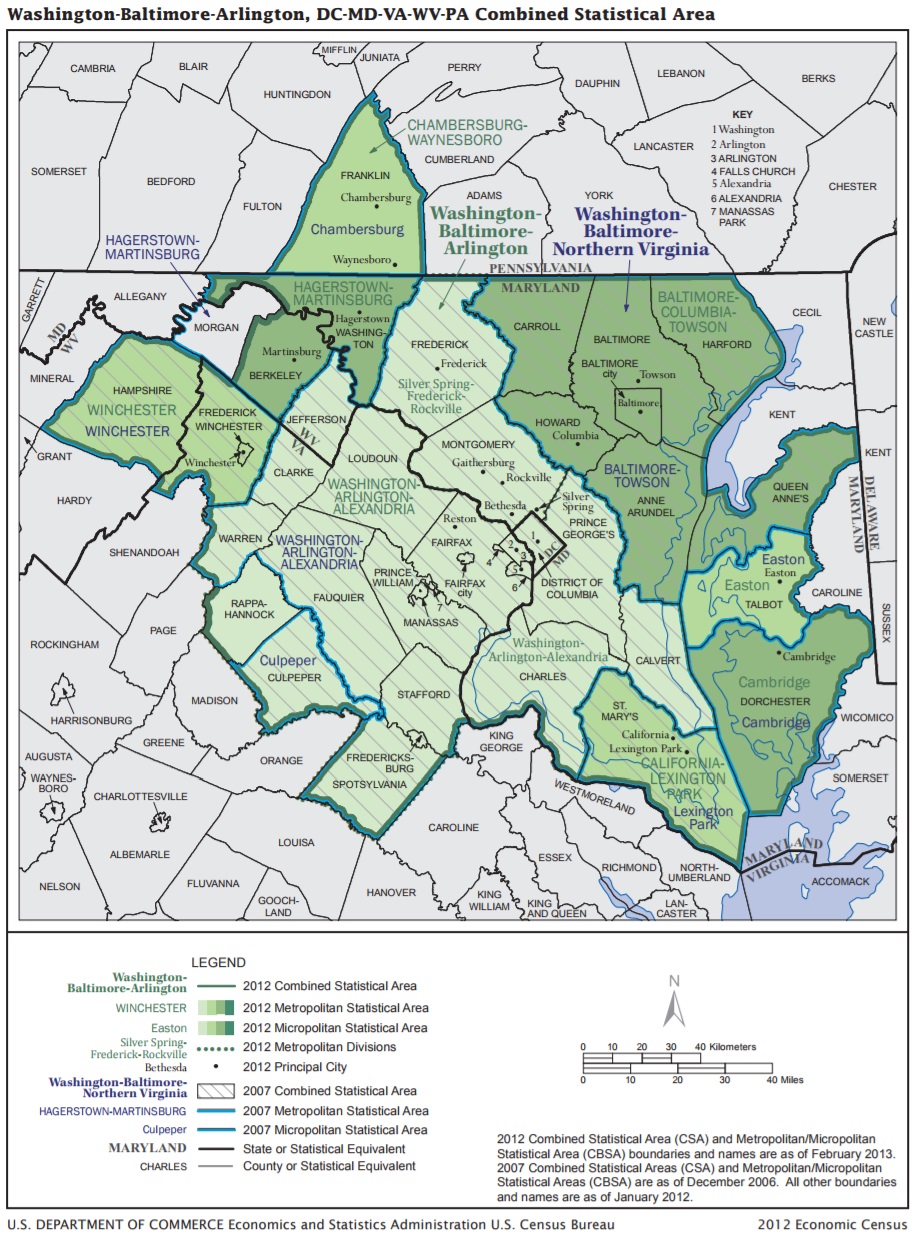


April 18, 2019
Did you know?, Government/Politics