Pyrmont is Australia’s most densely populated suburb

Matt Wade
Sydney Morning Herald
It was once known for wharves, shipyards and stores. But the neighborhood of Pyrmont-Ultimo has a new distinction: it is Australia’s most densely populated suburb.
New figures from the Bureau of Statistics show Pyrmont-Ultimo had 13,850 residents a square kilometre (0.386 Square Miles) in June 2012.
It was one of four suburbs that ring Sydney’s CBD with population densities of more than 13,000 residents a square kilometre. The others were Potts Point-Woolloomooloo (13,600) , Darlinghurst (13,200) and Surry Hills (13,070).
Inner-city Melbourne had the next highest density, at 10,100 people a square kilometre. In Brisbane, the New Farm area had the highest population density, with 6000 people a square kilometre.
But Australia’s most densely populated suburbs aren’t nearly as crowded as districts in some other world cities. Hong Kong’s Kwun Tong district has a population density of more than 54, 000 people per square kilometre. The borough of Manhattan in New York City has a population density of over 25,000 people per square kilometre.
Eight of Australia’s 10 most densely populated statistical areas are in Sydney. But population density falls rapidly with distance from the CBD.
At Bondi Beach, it was 8800 residents a square kilometre, and in Redfern-Chippendale it was 8400. Marrickville’s population density was 4530 per square km while in the Ku-ring-gai area the average falls to less than 1400 a square kilometre.
In Camden, on the city’s fringe, the figure was less than 500.
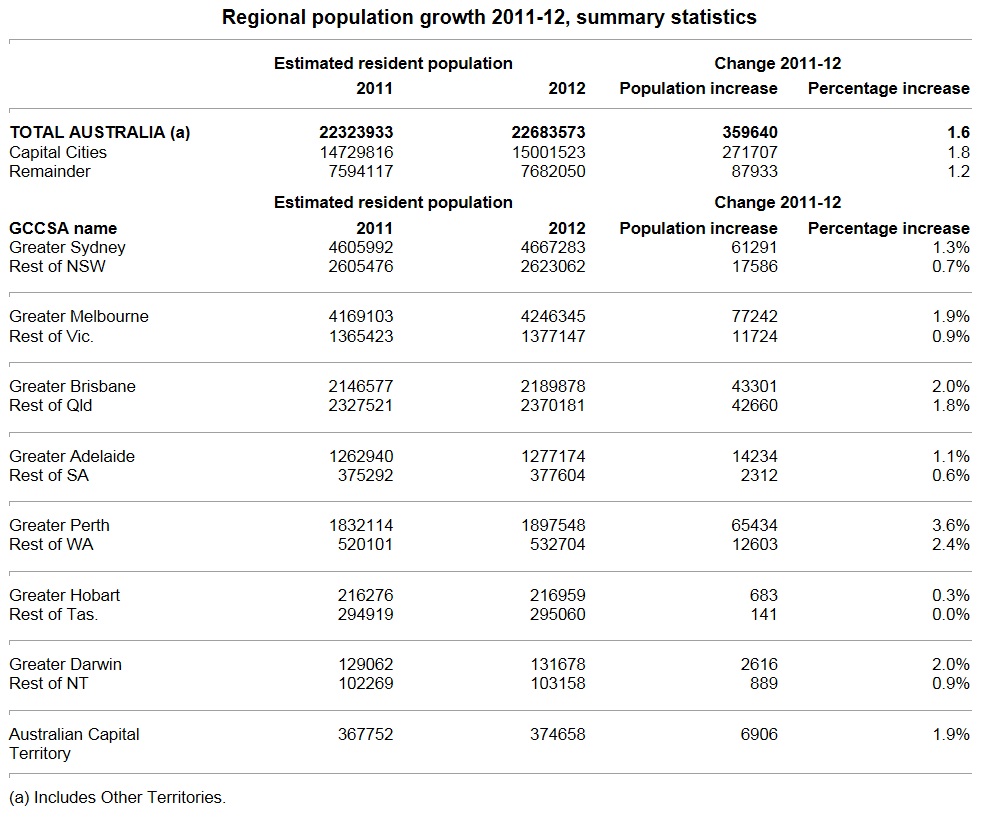
The bureau said the combined population of Australia’s capital cities rose by 271,700 in the year to 2012. More than 15 million people – close to two-thirds of Australia’s population – were residing in one of the capitals.
At the other end of the scale, there were over 200 statistical districts with population densities of less than one person per square kilometre, the bureau said. The majority were in Queensland, Western Australia and New South Wales.
___________
Video: Pyrmont neighborhood
___________
Video: Australia’s population to hit 23 million on April 23, 2013
___________
Video: Australia’s 23 million and what it means
___________

__________________

Release date 30 April 2013
The four most densely populated areas in the country all surround Sydney’s central business district, according to the Australian Bureau of Statistics (ABS).
ABS Director of Demography, Bjorn Jarvis, said the four locations with the highest population density in Australia were:
- Pyrmont – Ultimo;
- Potts Point – Woolloomooloo;
- Darlinghurst; and
- Surry Hills
“Each of these areas has a population density of over 13,000 residents per square kilometre,” Mr Jarvis said.
“Inner-city Melbourne had the next highest density, at 10,100 people per square kilometre.
“Inner Melbourne also had the country’s largest increase in density in 2011-12, adding an extra 860 people per square kilometre over the year,” he said.
Outside the inner cities, newly established suburbs also had large increases in population density.
Population density in Bonner, on the northern fringes of Canberra, virtually doubled from 620 to 1,200 people per square kilometre.
Forde and Crace, up 480 and 450 people per square kilometre respectively, also had large increases.
New South Wales
Population growth in Sydney accounted for more than three-quarters of the state’s total growth. Parklea – Kellyville Ridge, in Sydney’s north-west growth corridor, had both the largest and fastest growth in the state (up 2,300 people or 10 per cent).
Victoria
Melbourne had the largest growth of all capital cities in Australia, up 77,200 people. The areas with the largest population increases in the country were all on the outskirts of Melbourne. They were South Morang and Craigieburn – Mickleham in the north, and Point Cook and Tarneit in the west, which grew by a combined 16,500 people in just one year.
Queensland
Growth in Brisbane (43,300 people) was almost matched by growth in the rest of the state (42,700). Outside of capital cities, the areas with the highest population densities in Australia were on Queensland’s Gold Coast including Mermaid Beach – Broadbeach and Surfers Paradise (both 3,700 people per square kilometre).
South Australia
Davoren Park in Adelaide’s north had the largest population growth in the state, up 710 people, while neighbouring Munno Para West – Angle Vale had the fastest growth, increasing by 8.3 per cent.
Western Australia
Perth was the fastest-growing of all capital cities, up 3.6 per cent. Forrestdale – Harrisdale – Piara Waters in Perth’s south-east was the fastest growing area in the state, increasing by 24 per cent to reach 9,600 people.
Tasmania
Hobart grew by 680 people, while the remainder of Tasmania increased by just 140 people. The areas with the fastest growth were Latrobe (up 2.8 per cent) in the state’s north, and Margate – Snug (2.7 per cent) in Hobart’s south.
Northern Territory
The Darwin suburbs of Rosebery – Bellamack (up 10 per cent) and Lyons (6 per cent), were the fastest-growing areas in the NT. Rosebery – Bellamack also had the largest growth (up 380 people), followed by Katherine (260) in the Lower Top End.
Australian Capital Territory
The population of the northern regions increased by 7,500 people, while the south decreased by 630. The northern region of Gungahlin contributed the most to this growth, increasing by 5,100 people.
Media notes: 1) When reporting ABS data you must attribute the Australian Bureau of Statistics (or the ABS) as the source. 2) Unless otherwise stated, areas mentioned in this release are defined as Statistical Areas Level 2 (SA2s), regions as Statistical Areas Level 3 (SA3s) and capital cities as Greater Capital City Statistical Areas. 3) Fastest growth rankings exclude areas with less than 1,000 people at June 2011.
Sydney


May 1, 2013
Did you know?, International