How racially diverse are American cities? Check these maps out

The Map
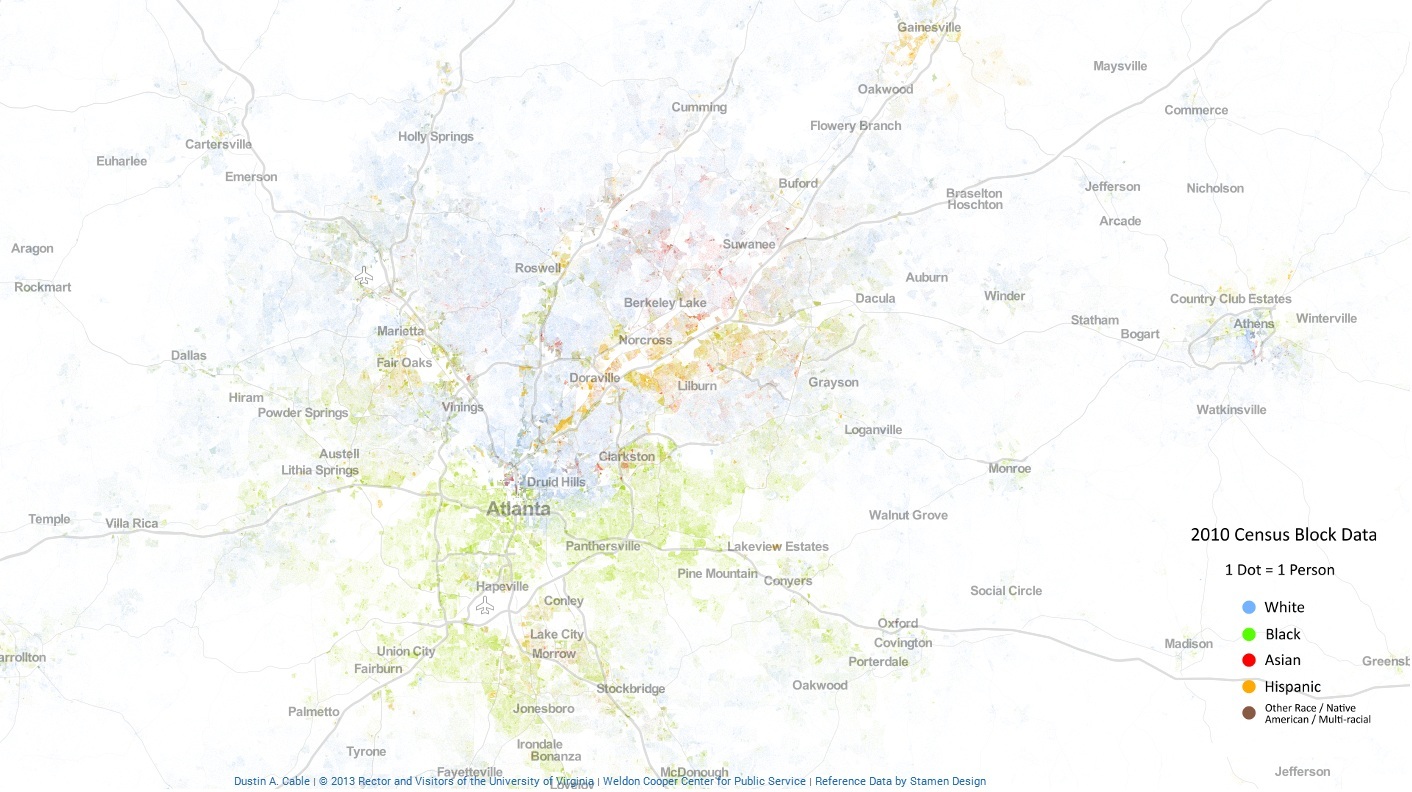
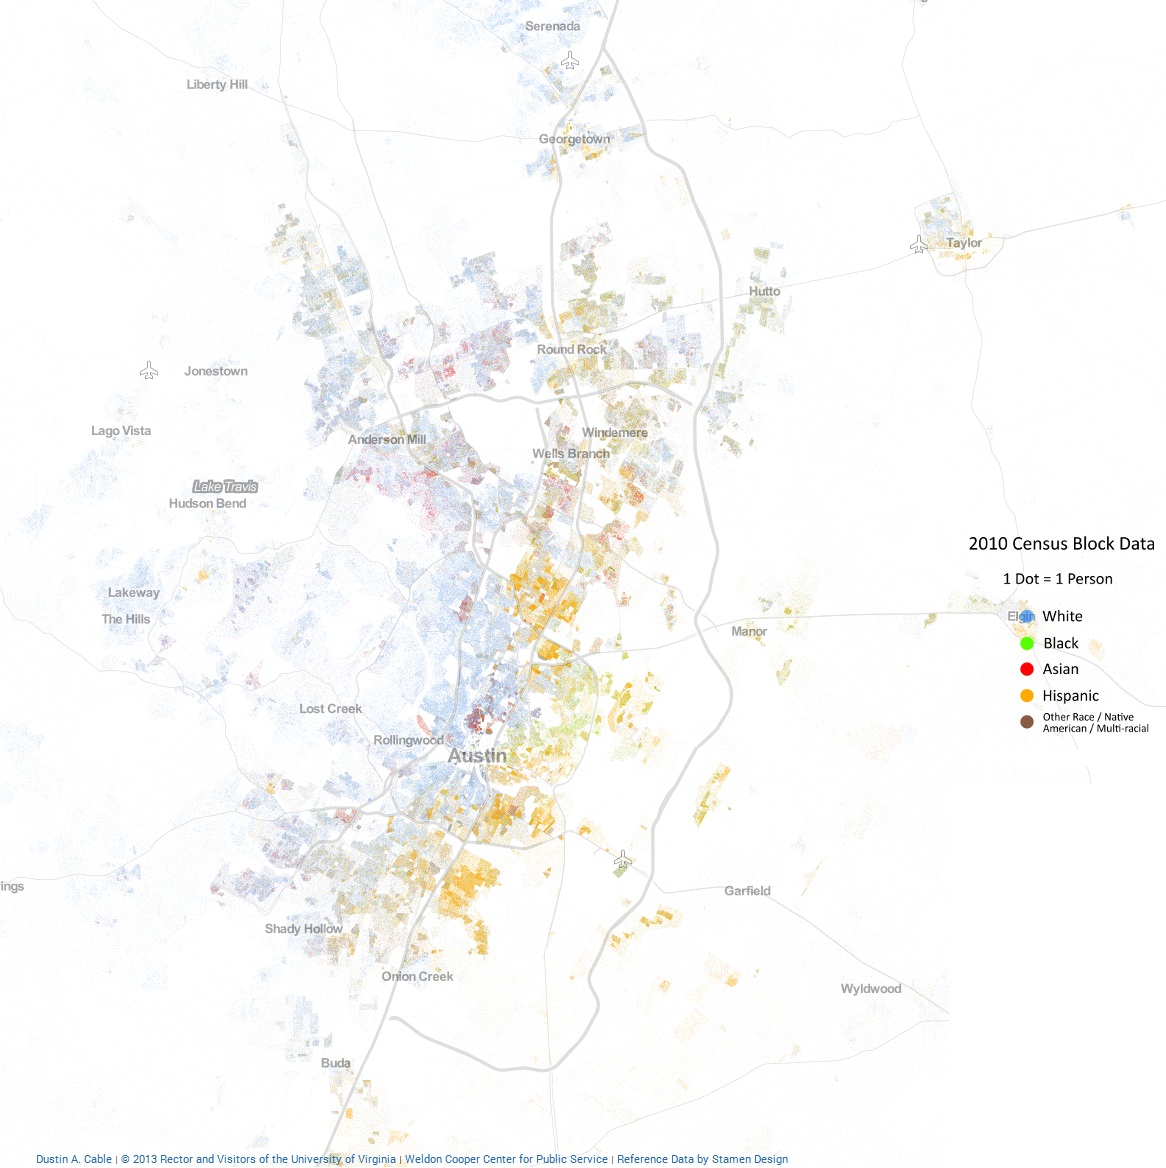
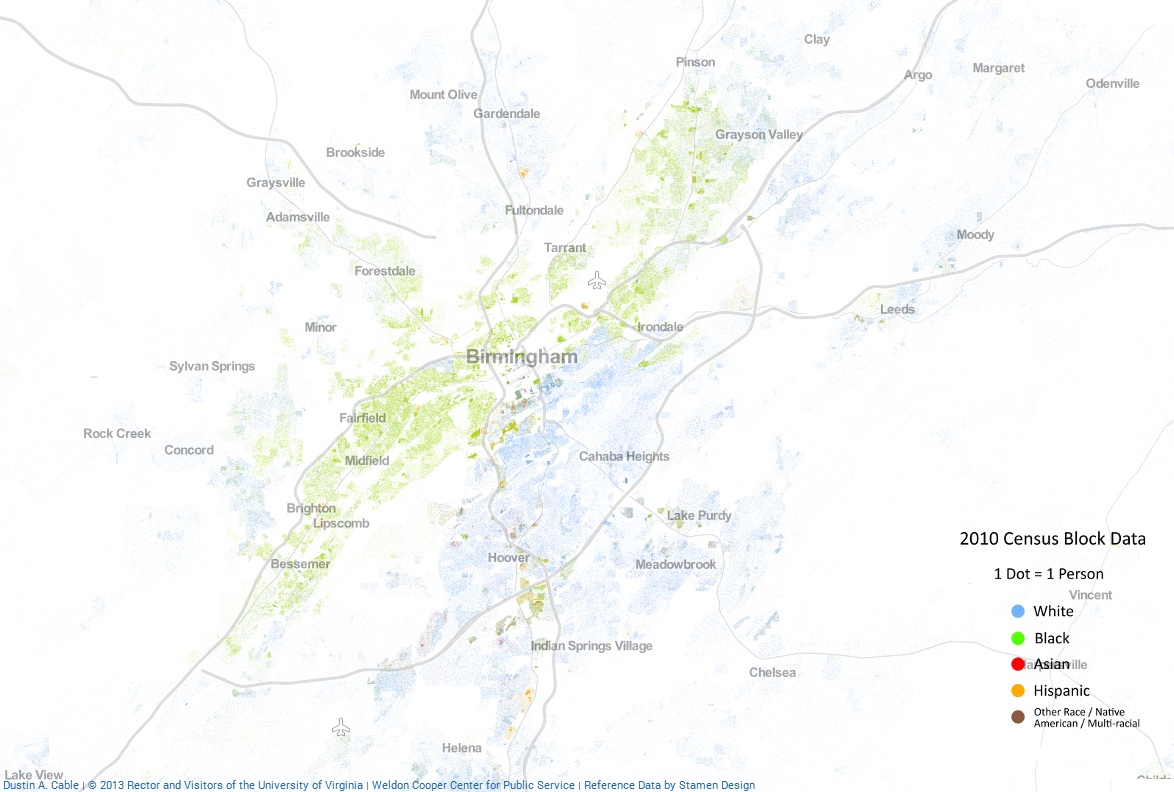
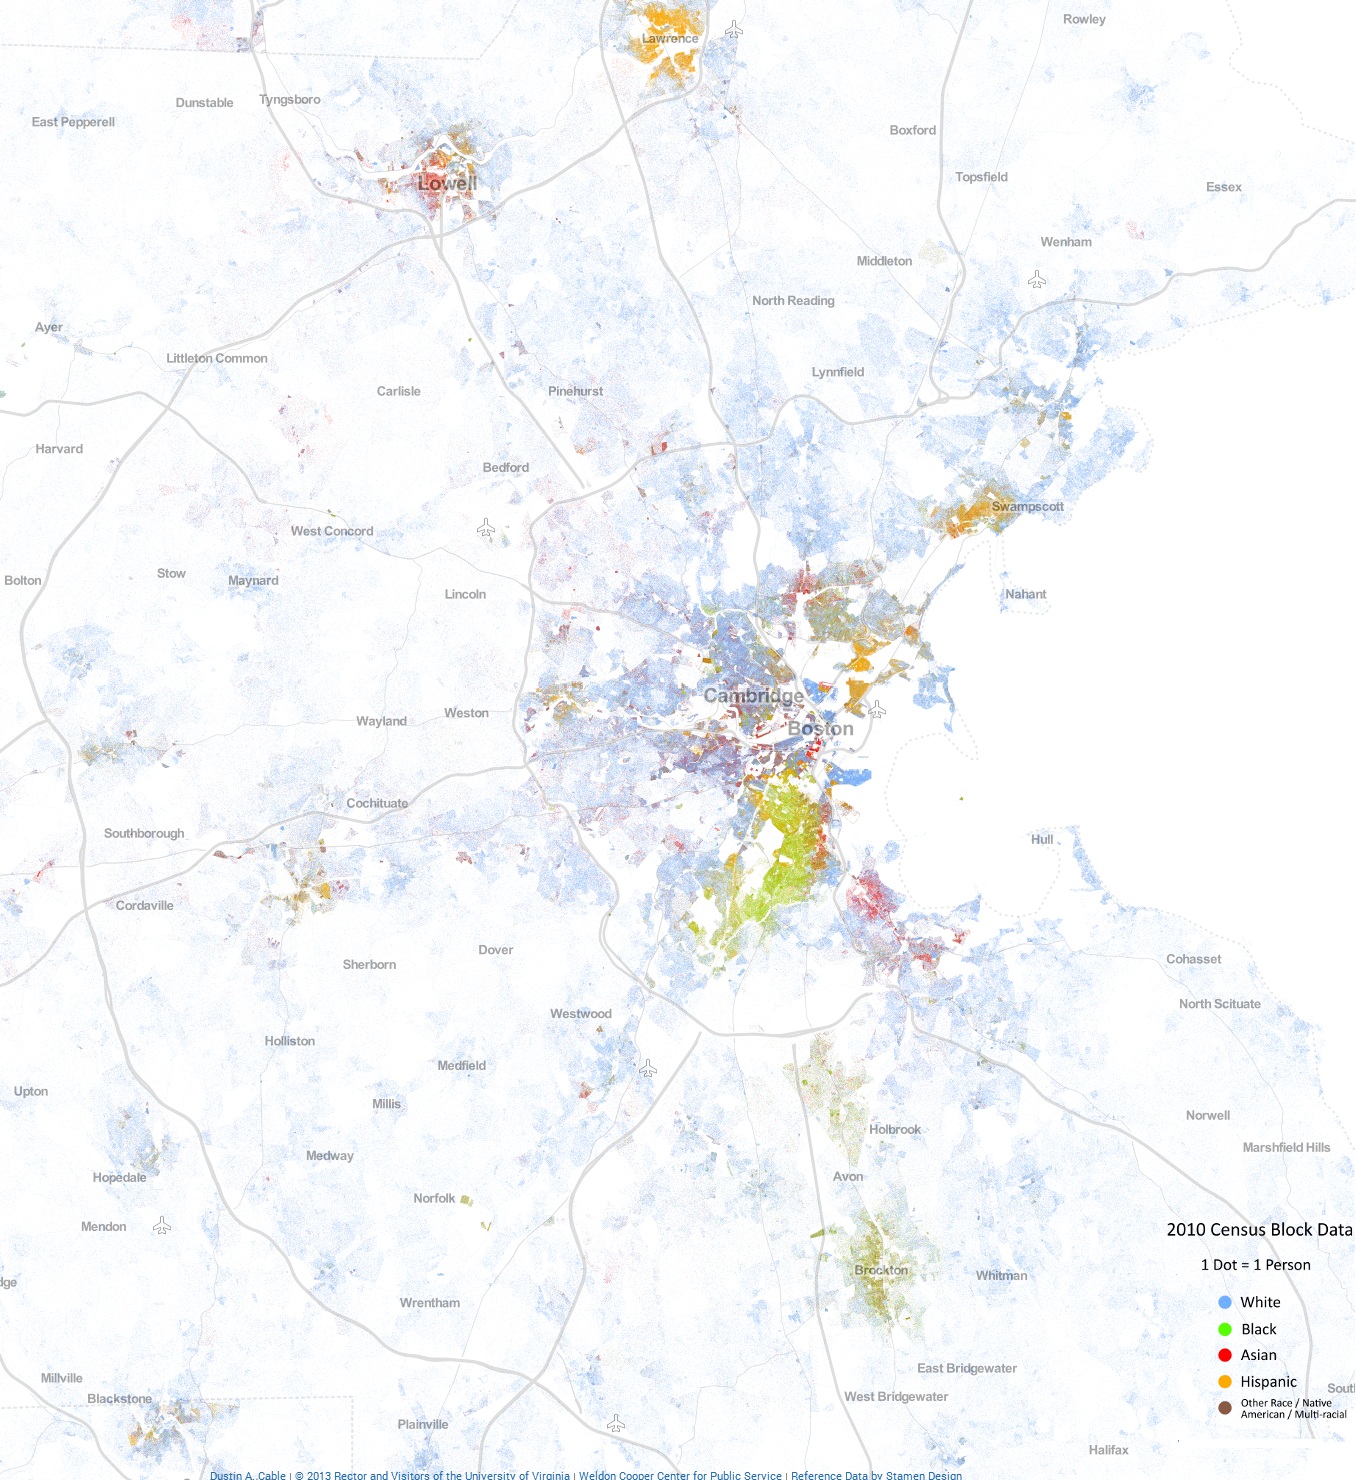
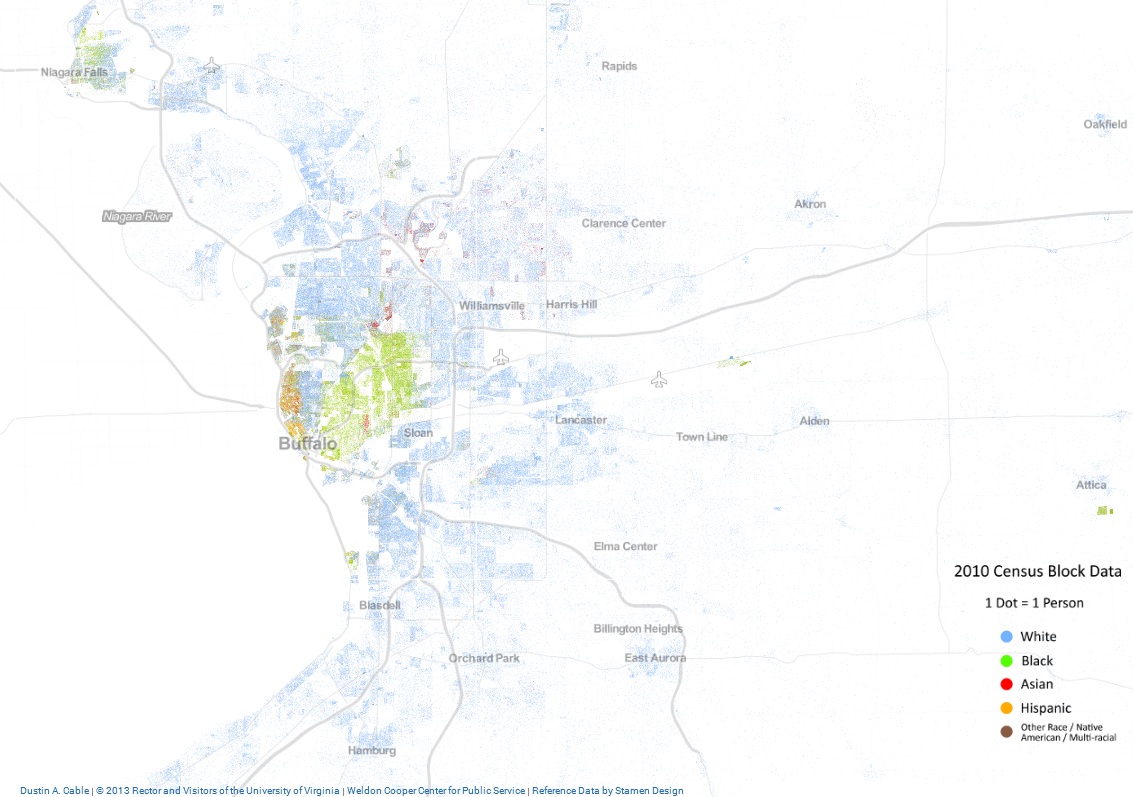
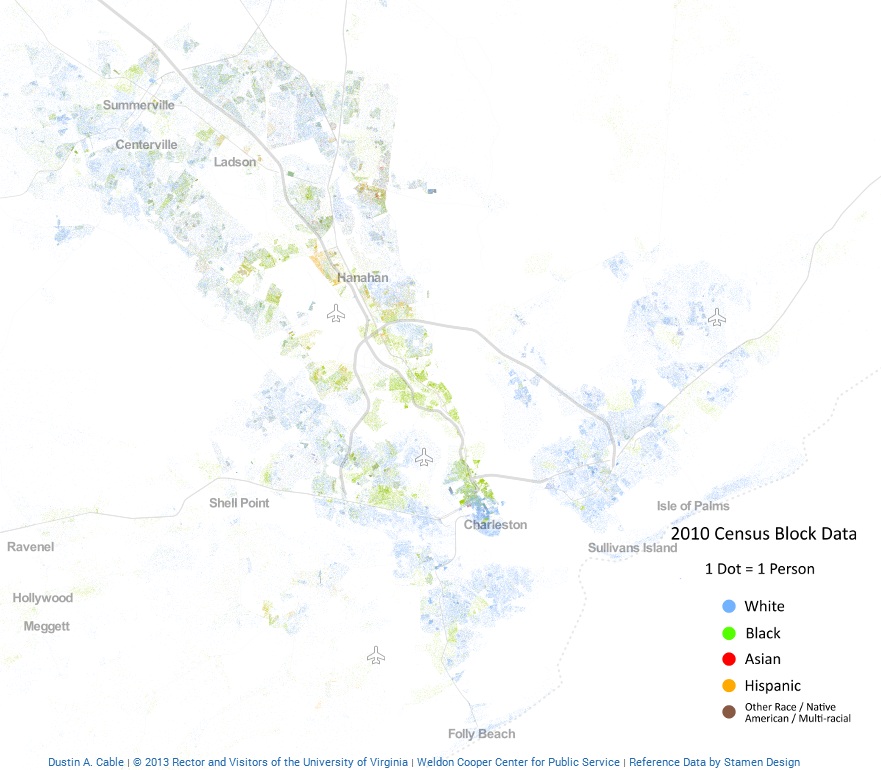
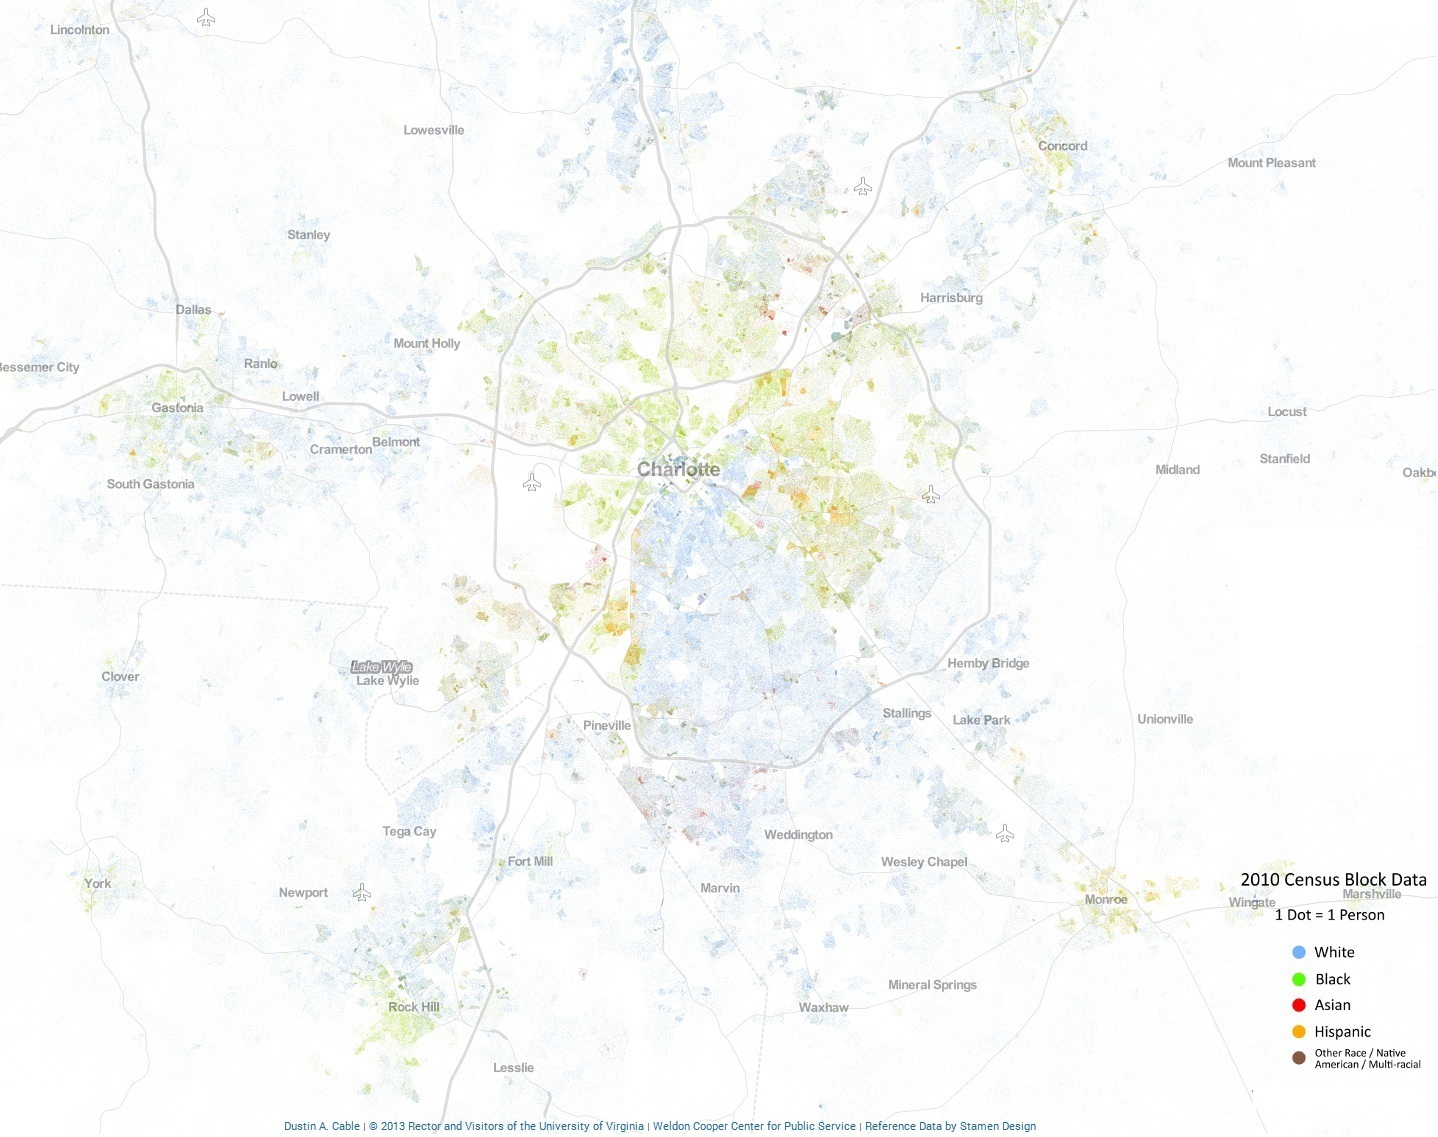
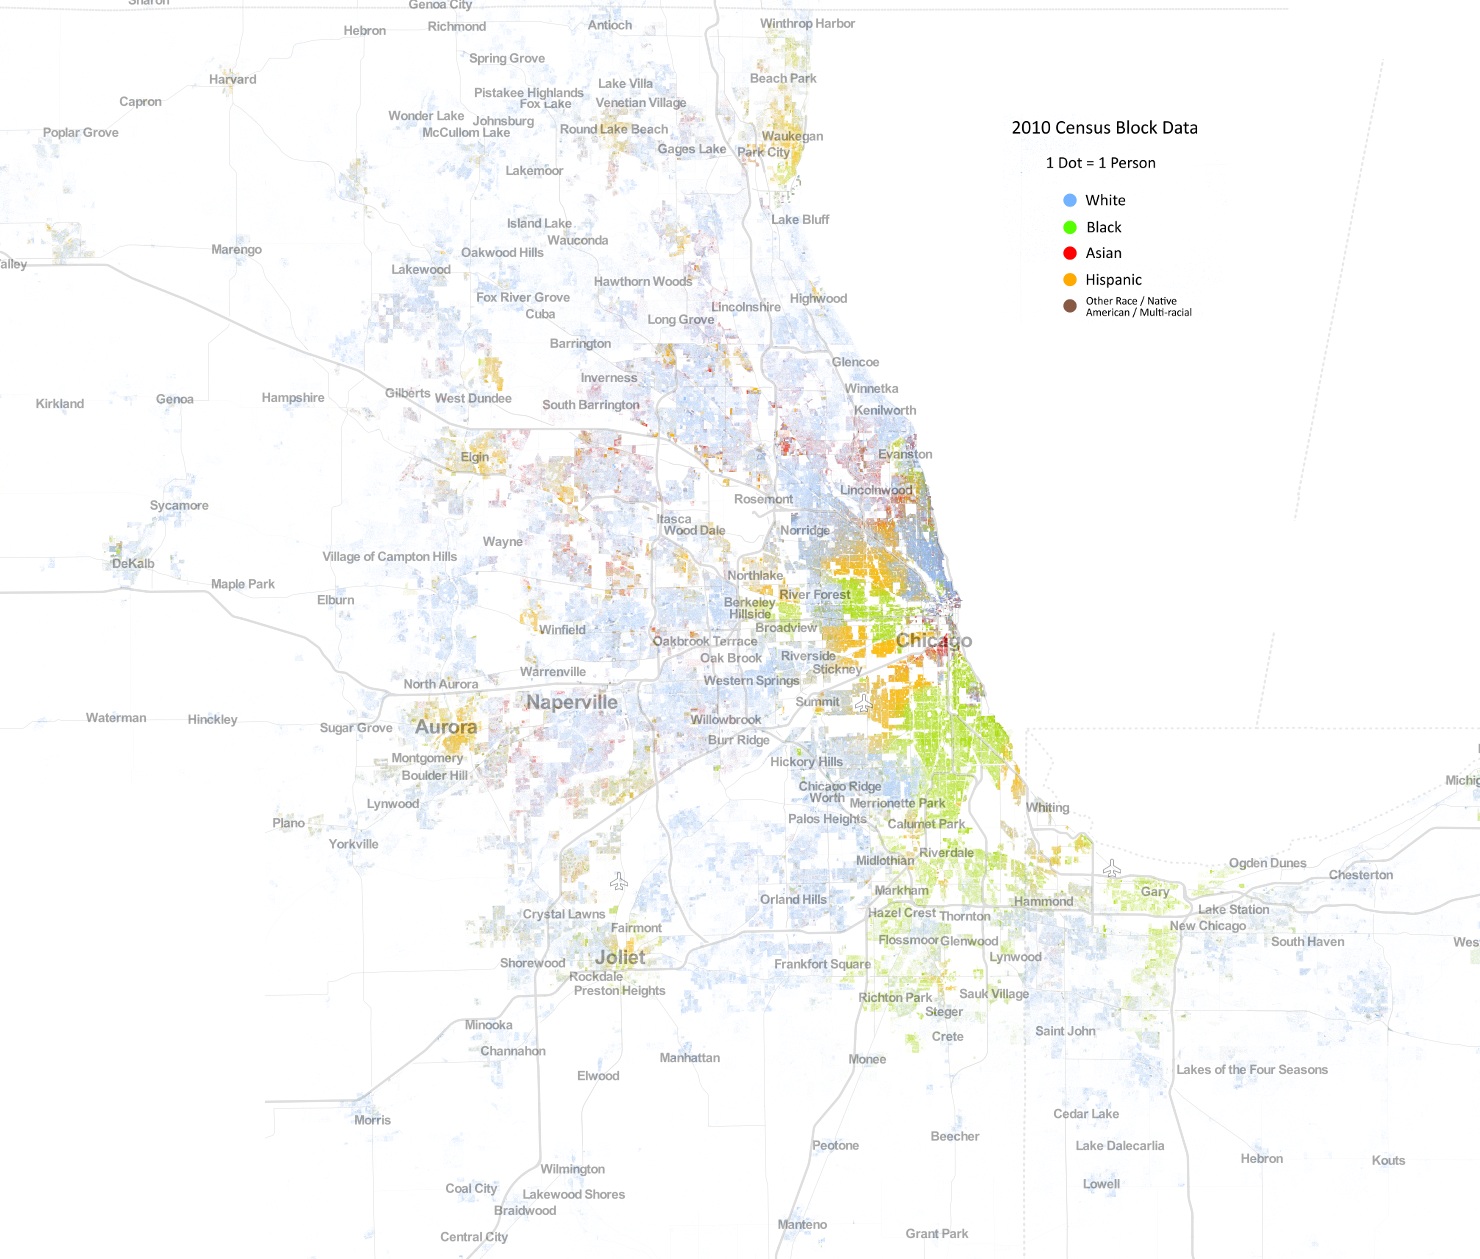
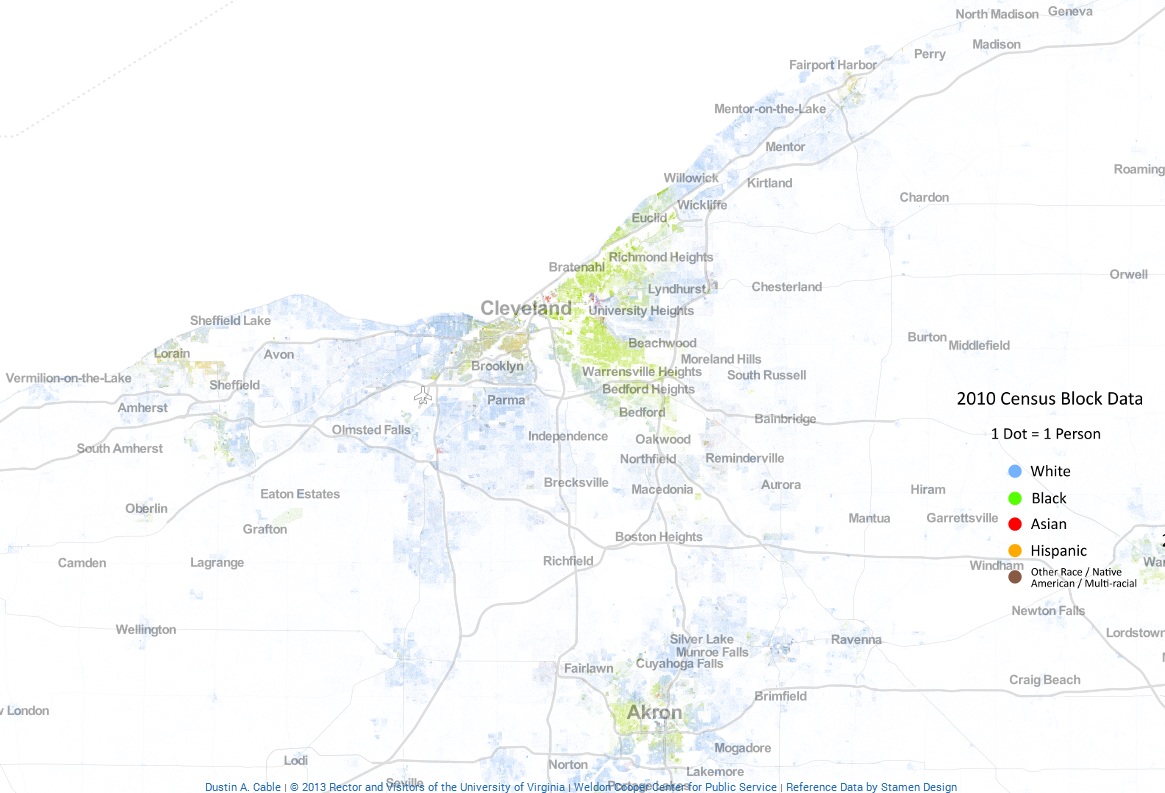
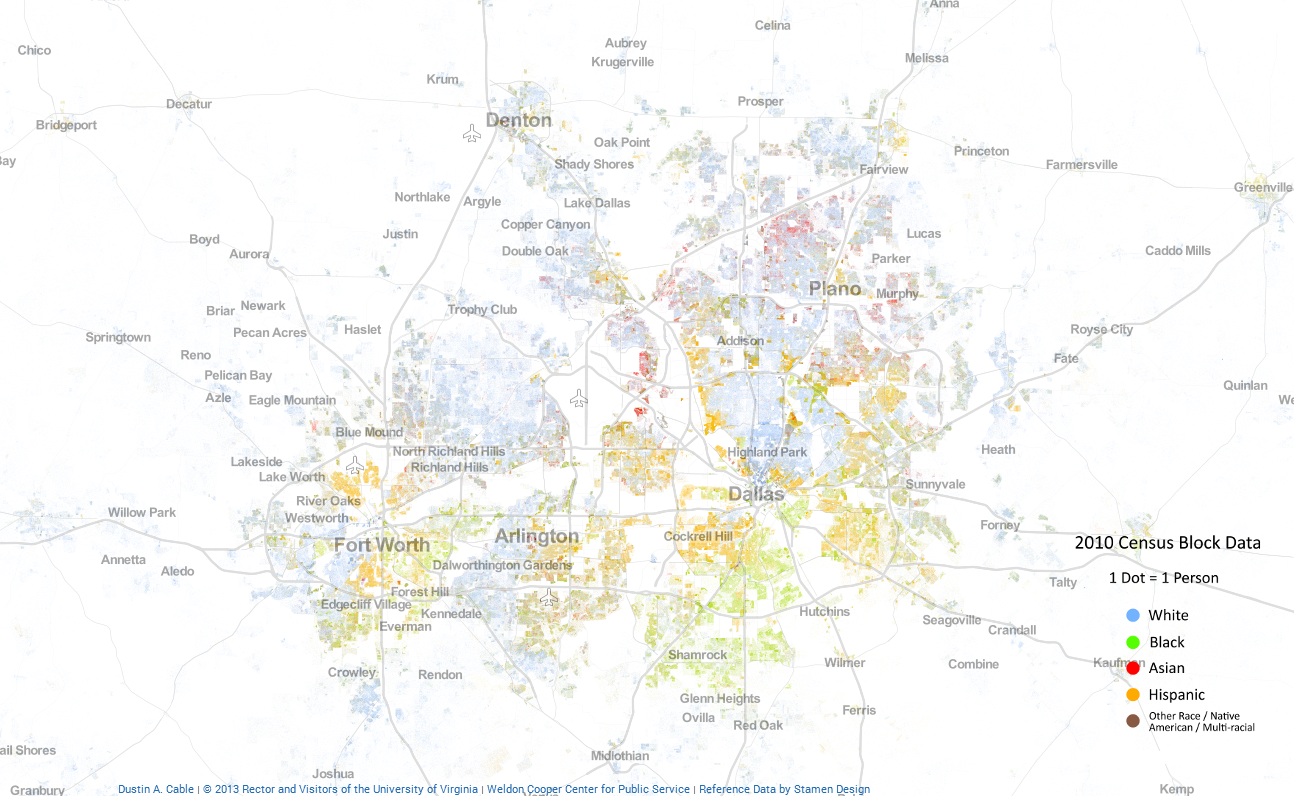
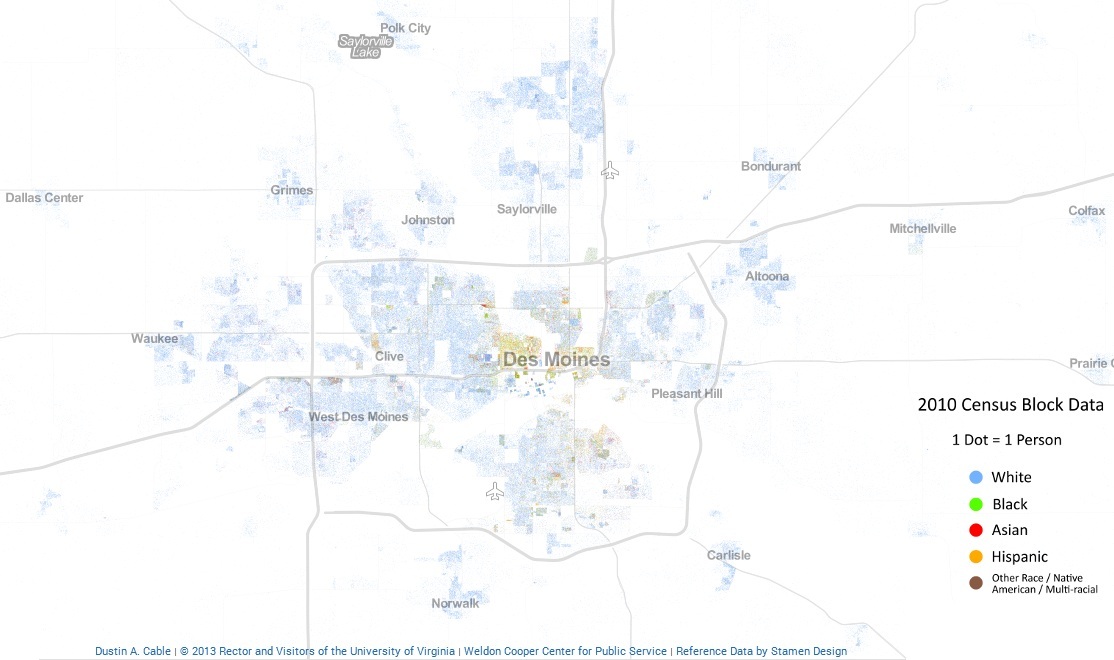
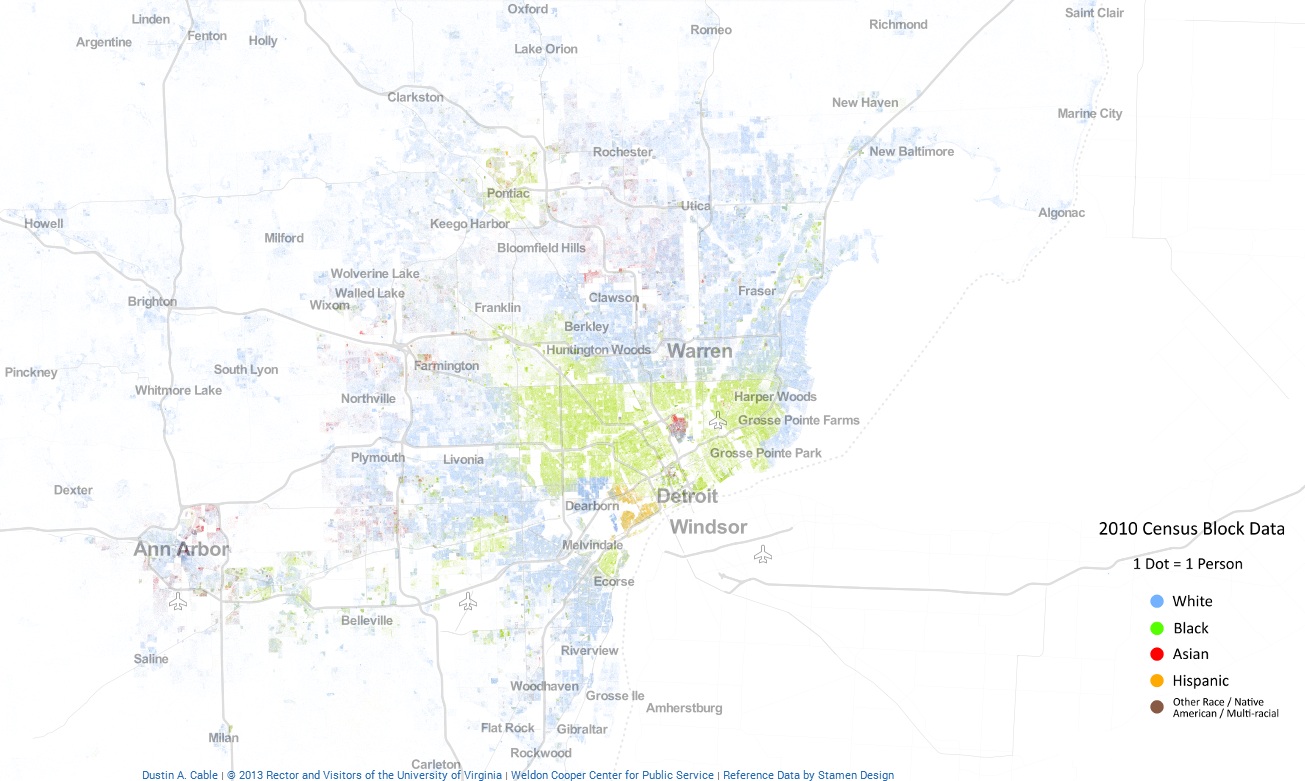
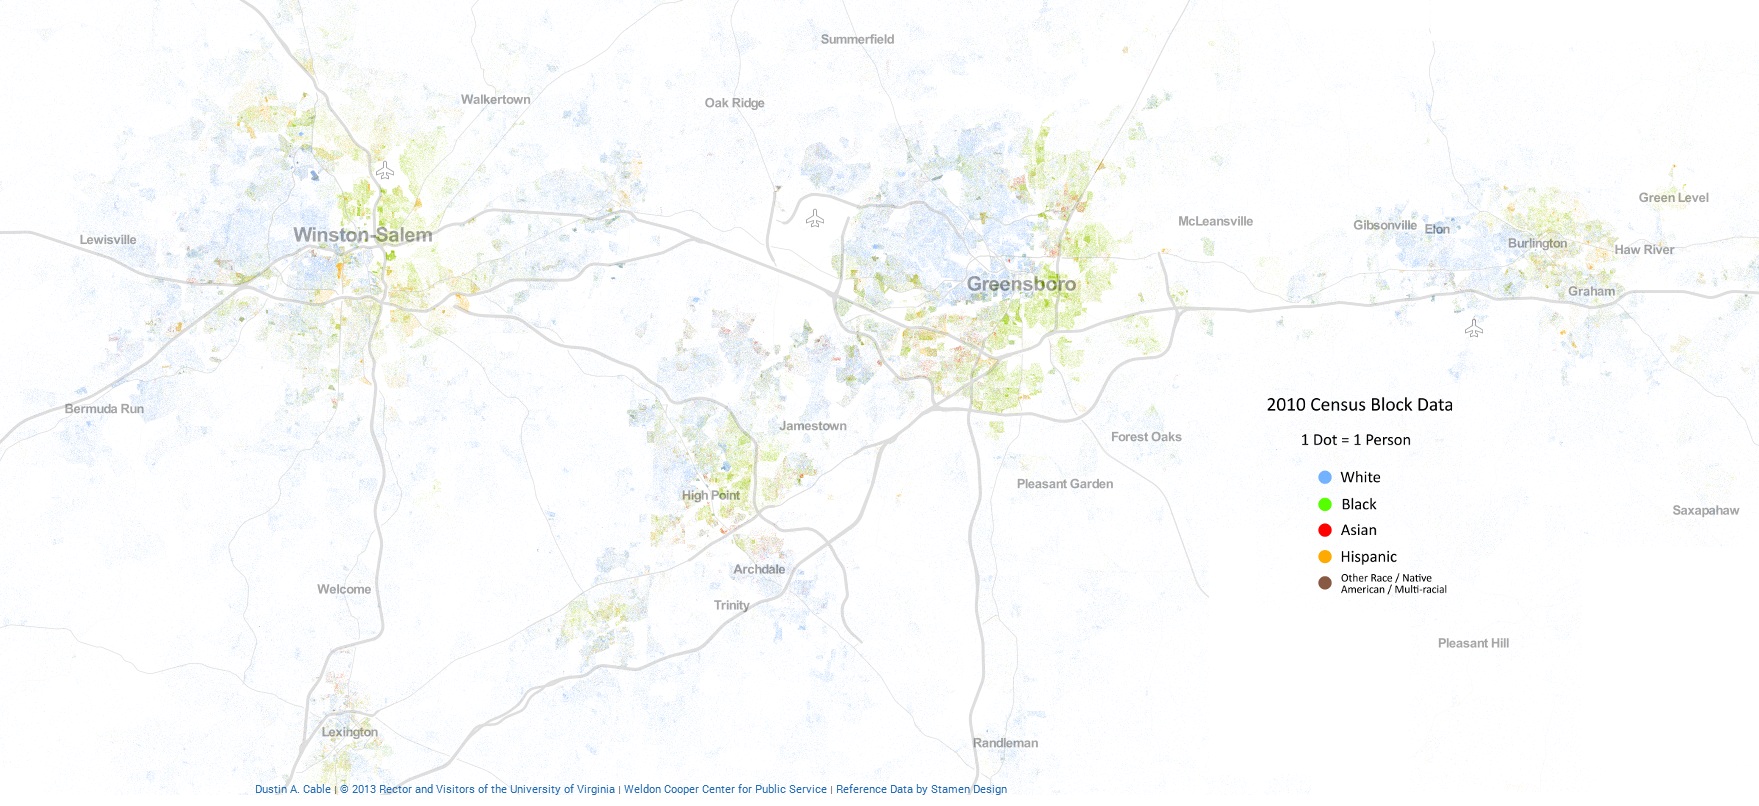
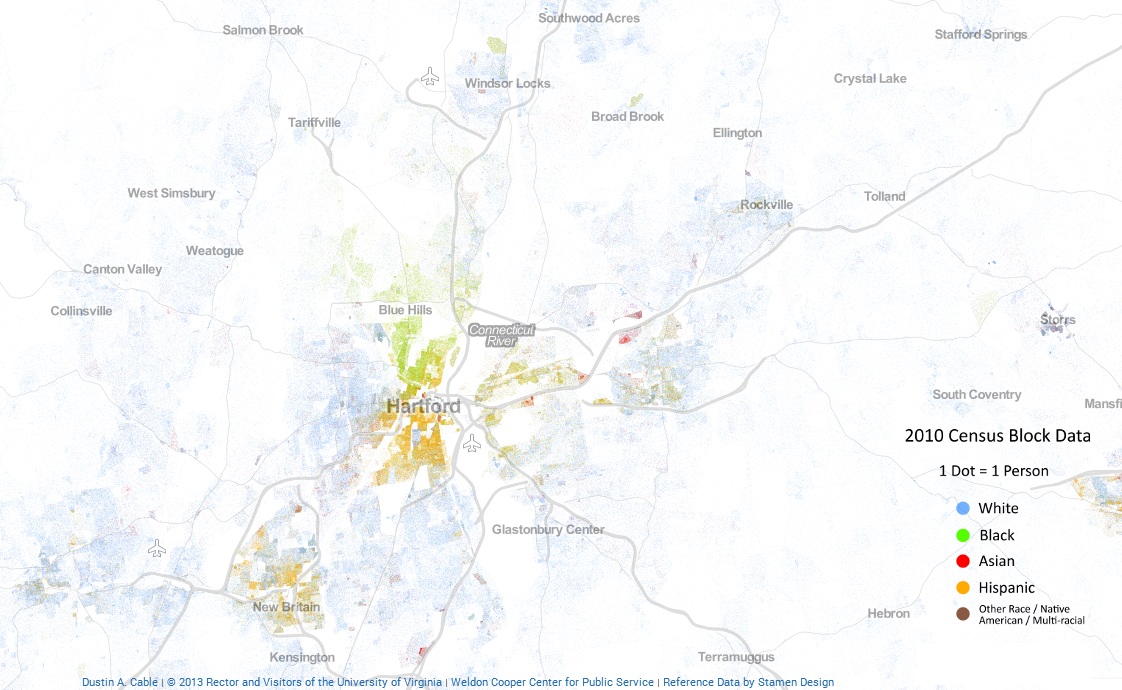
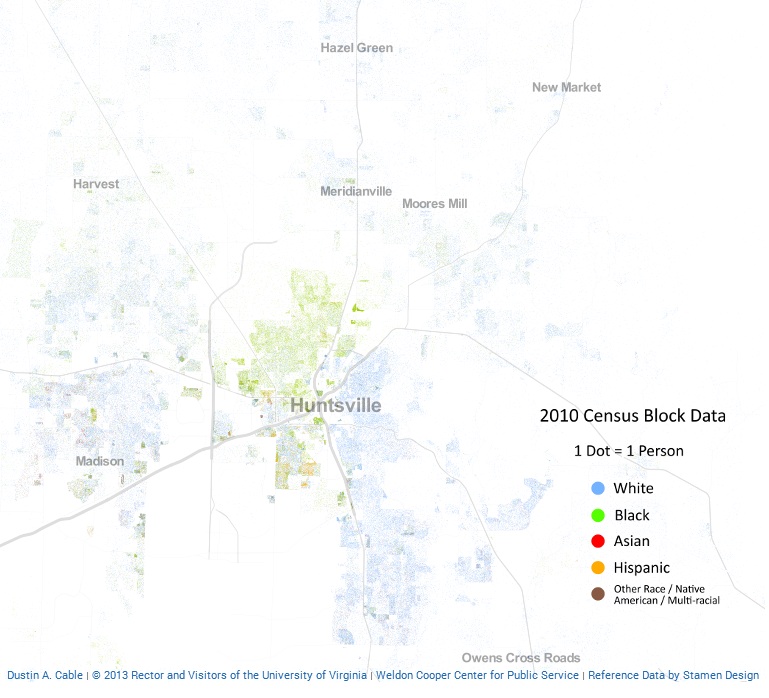
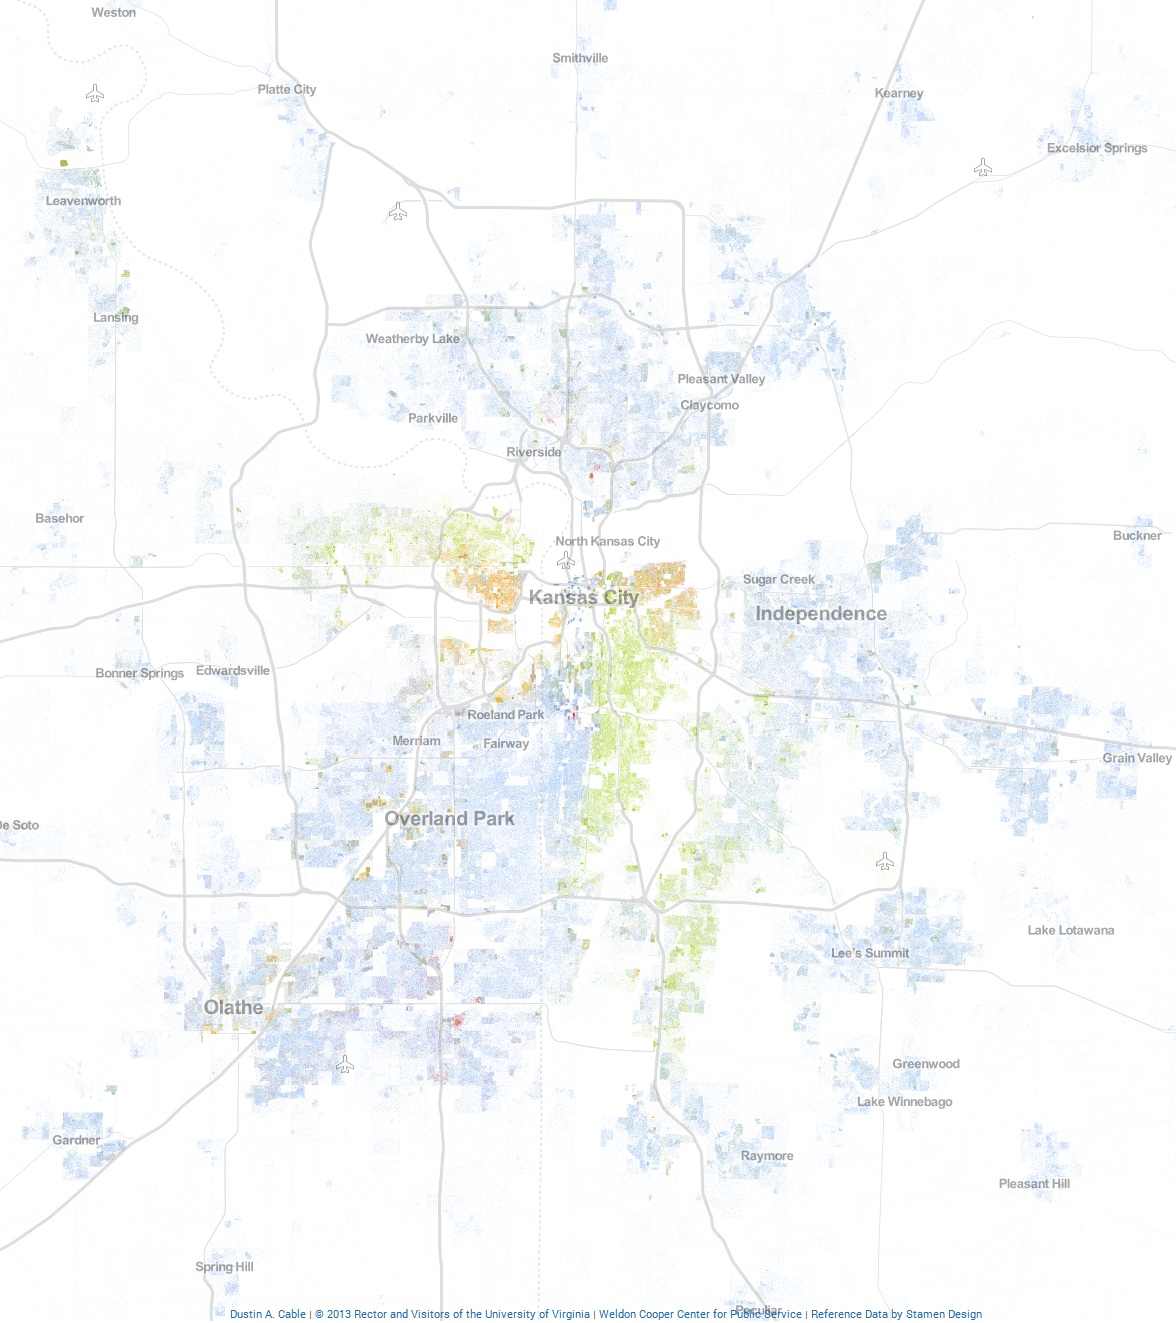
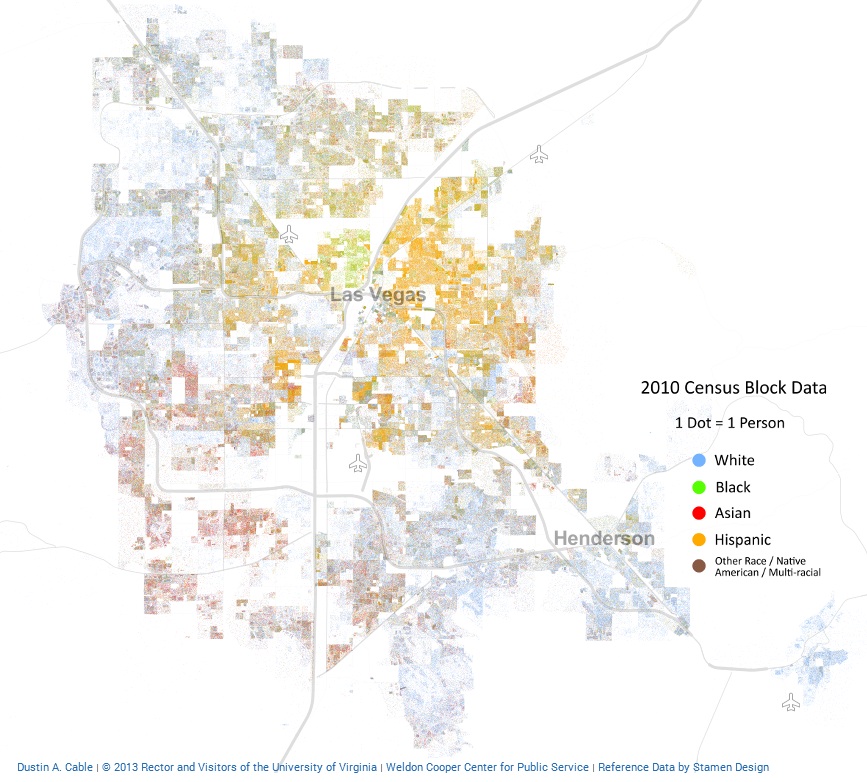
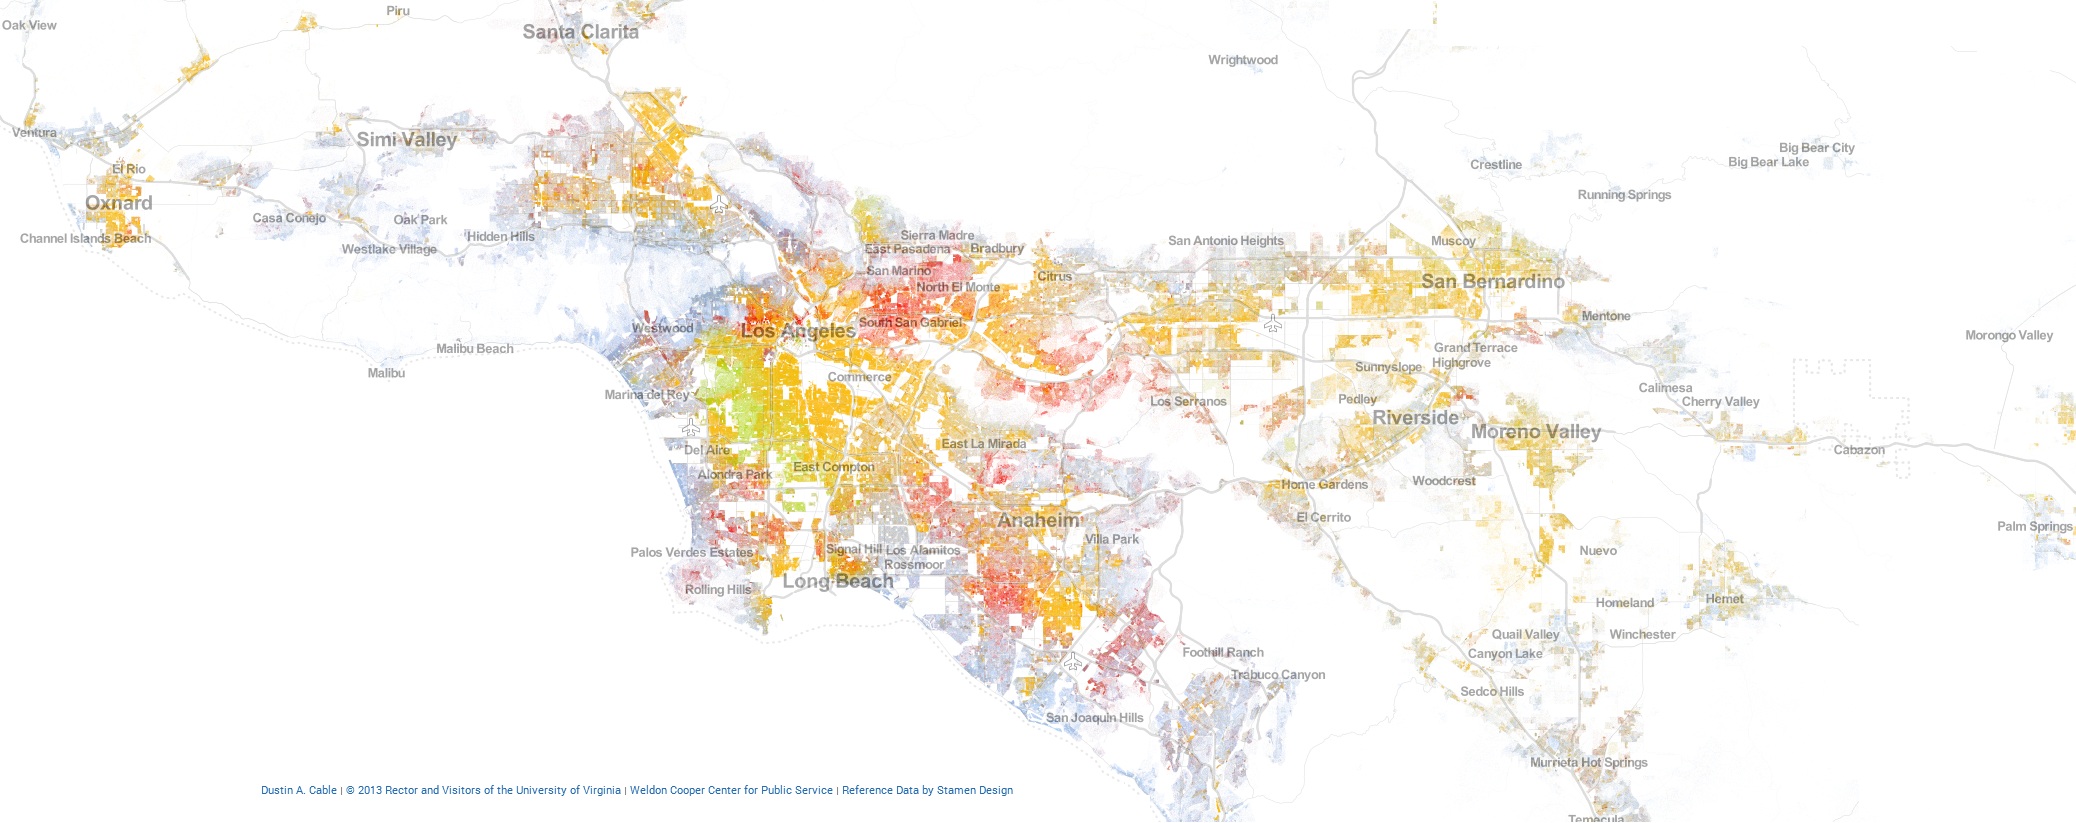
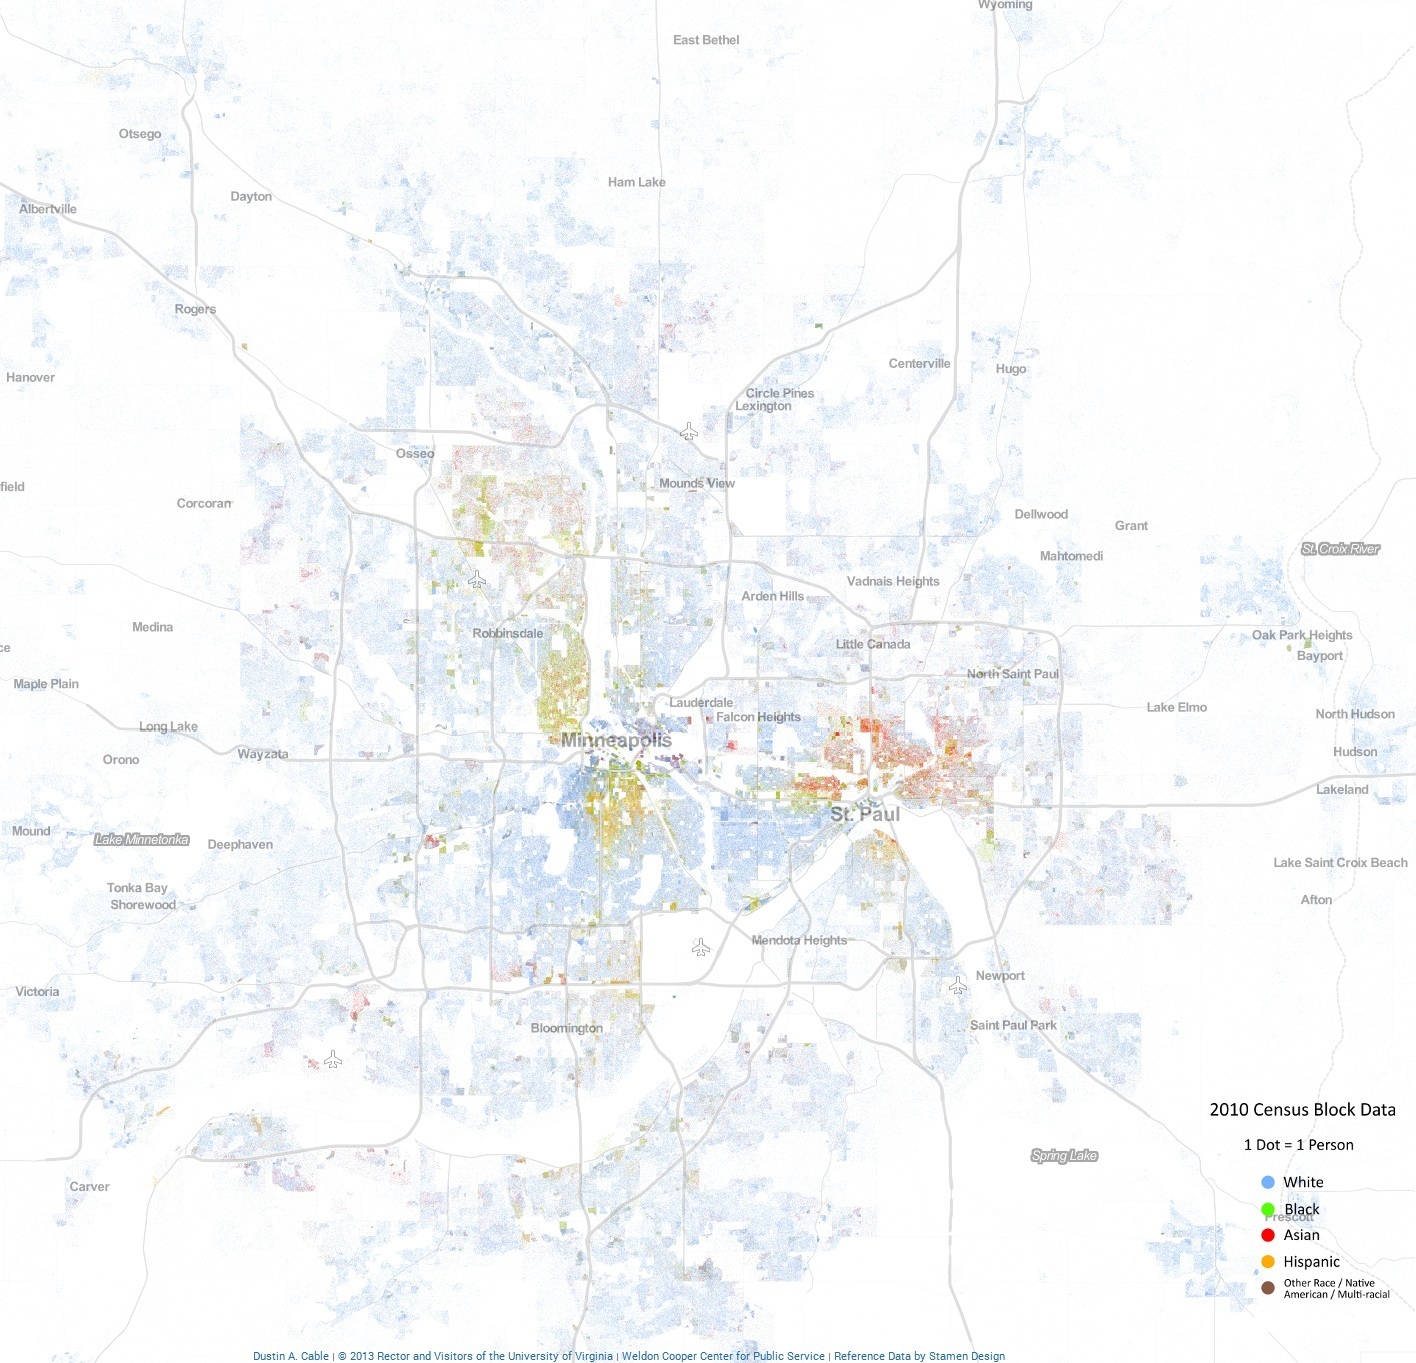
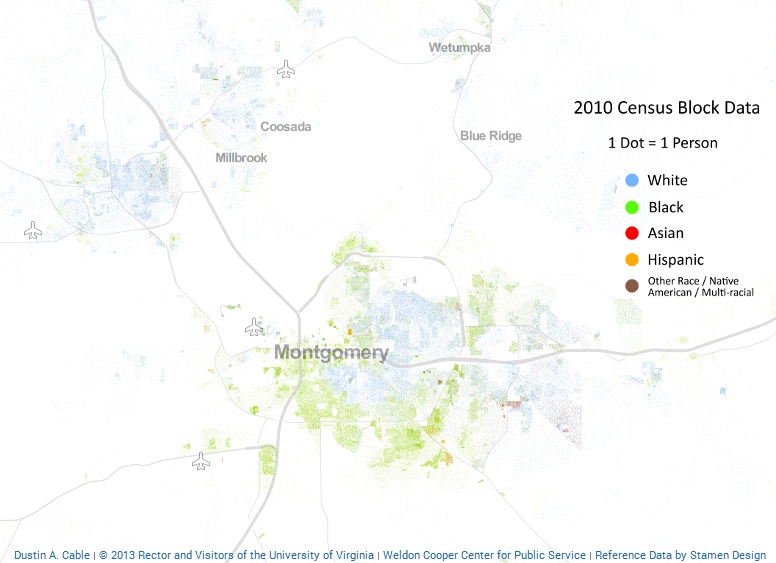
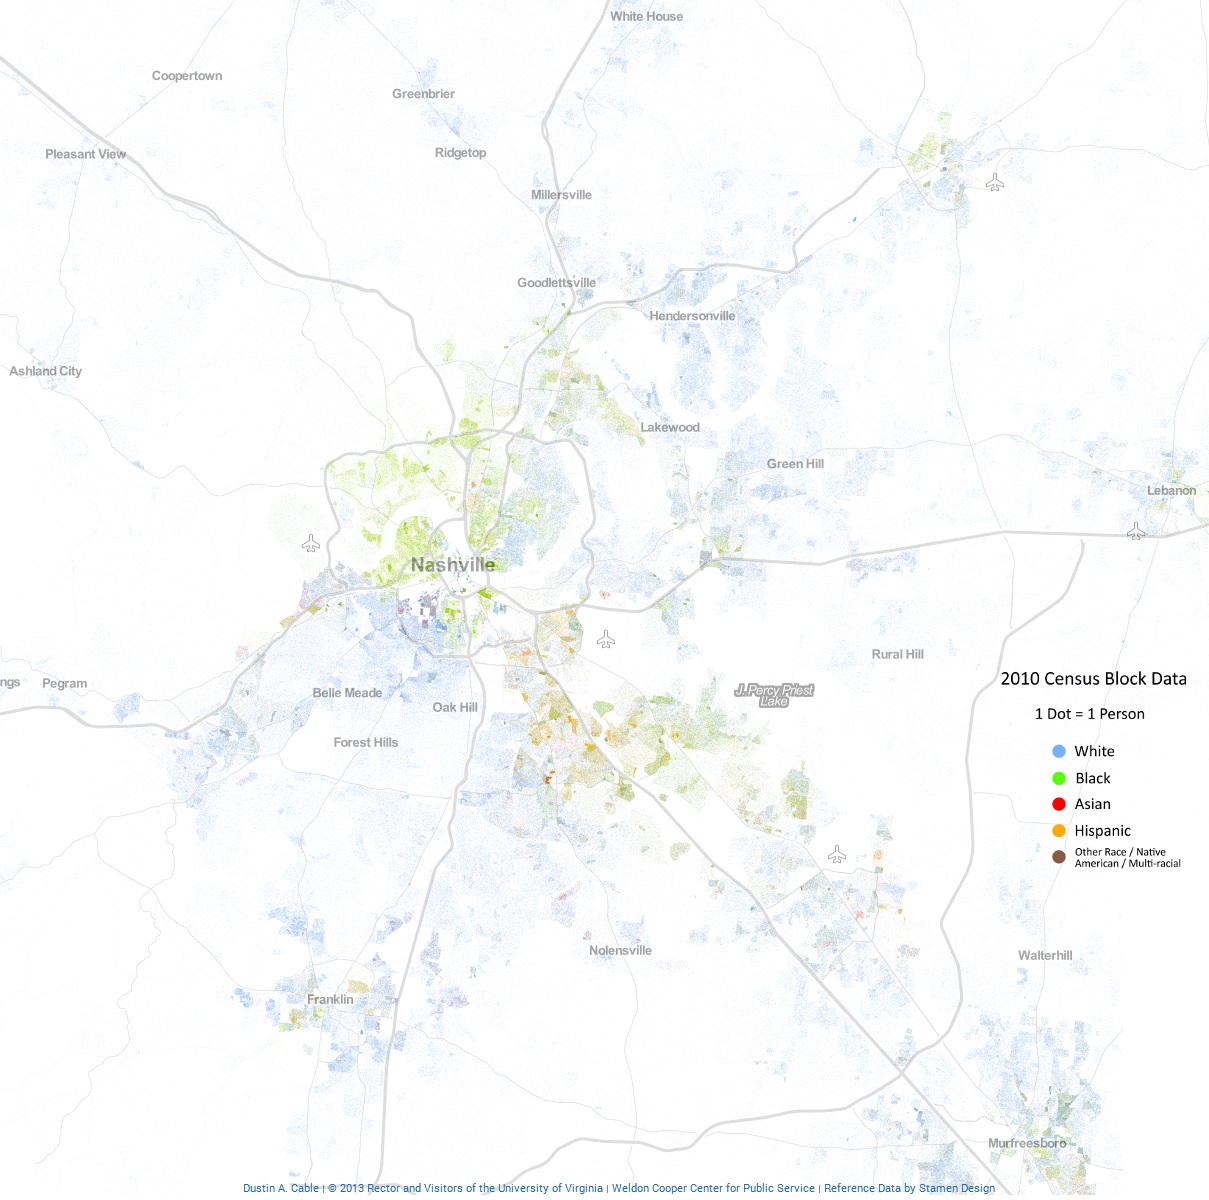
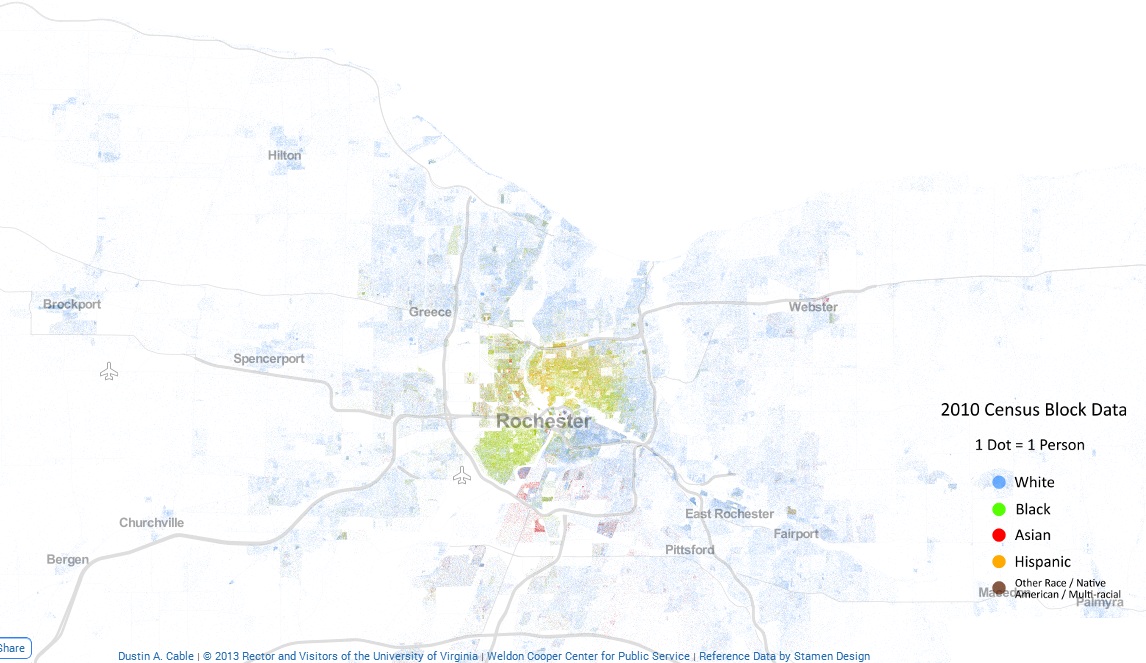
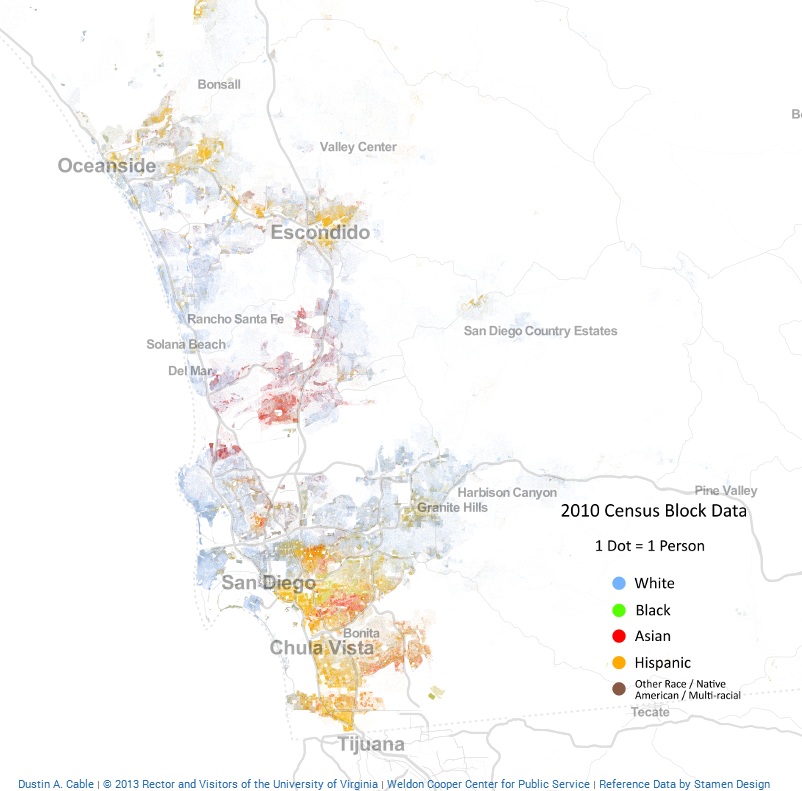
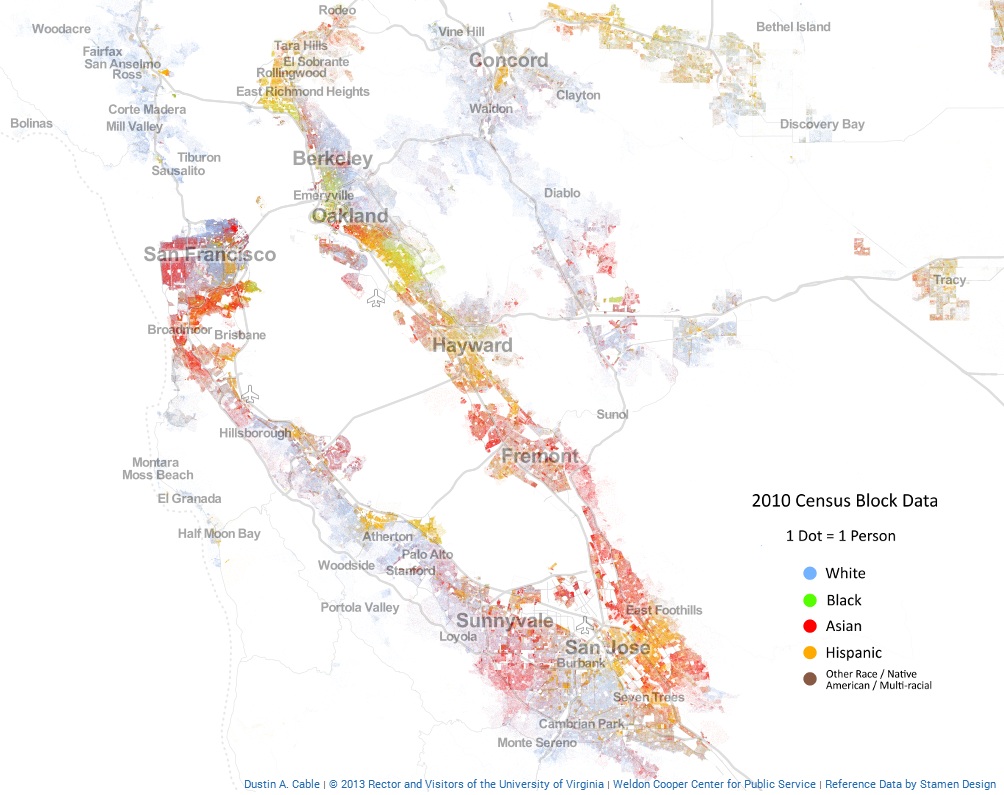
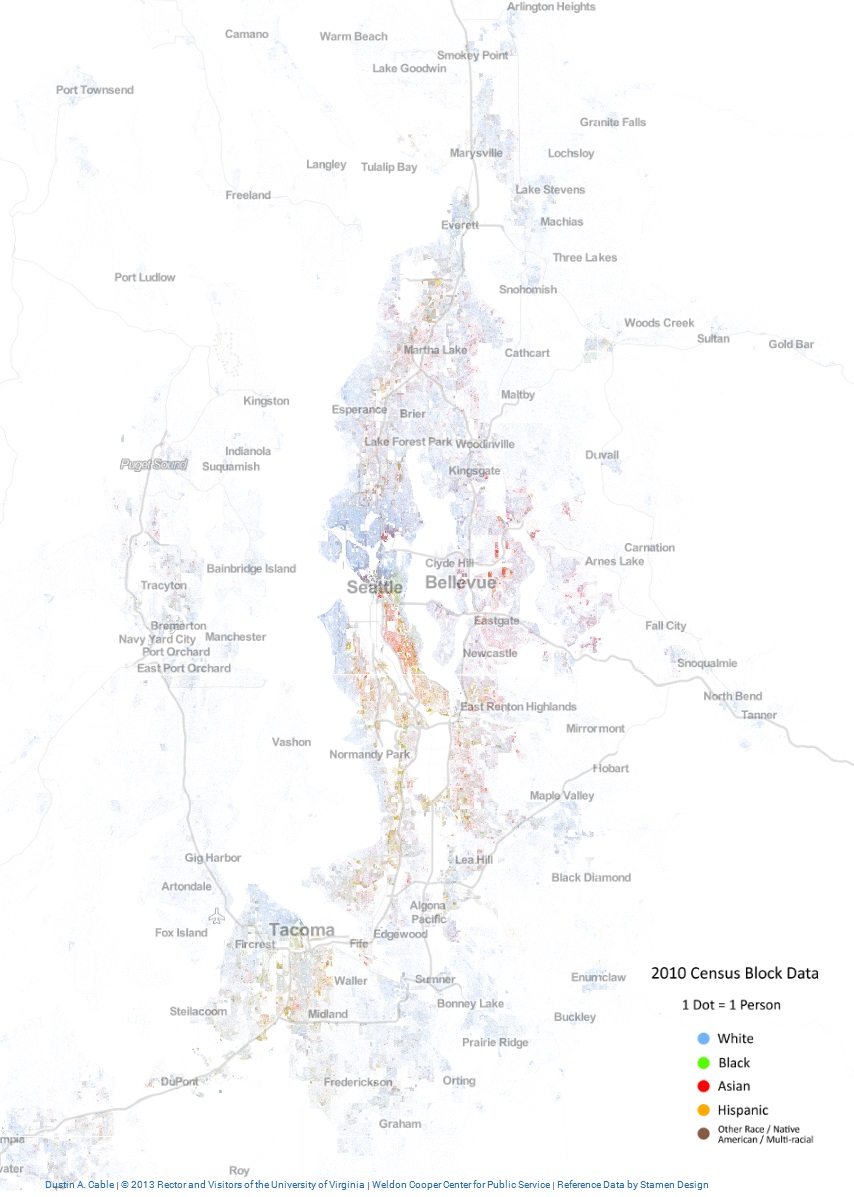
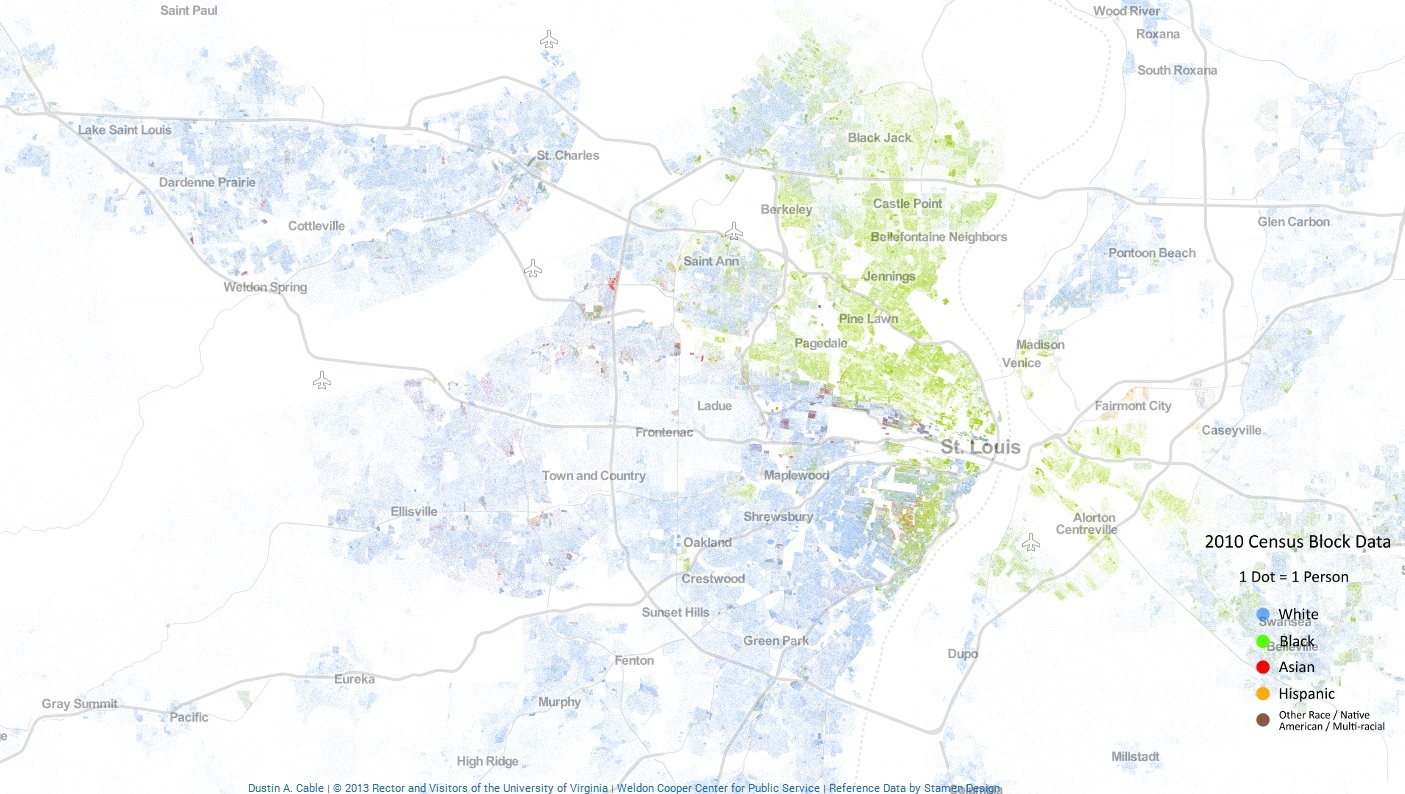
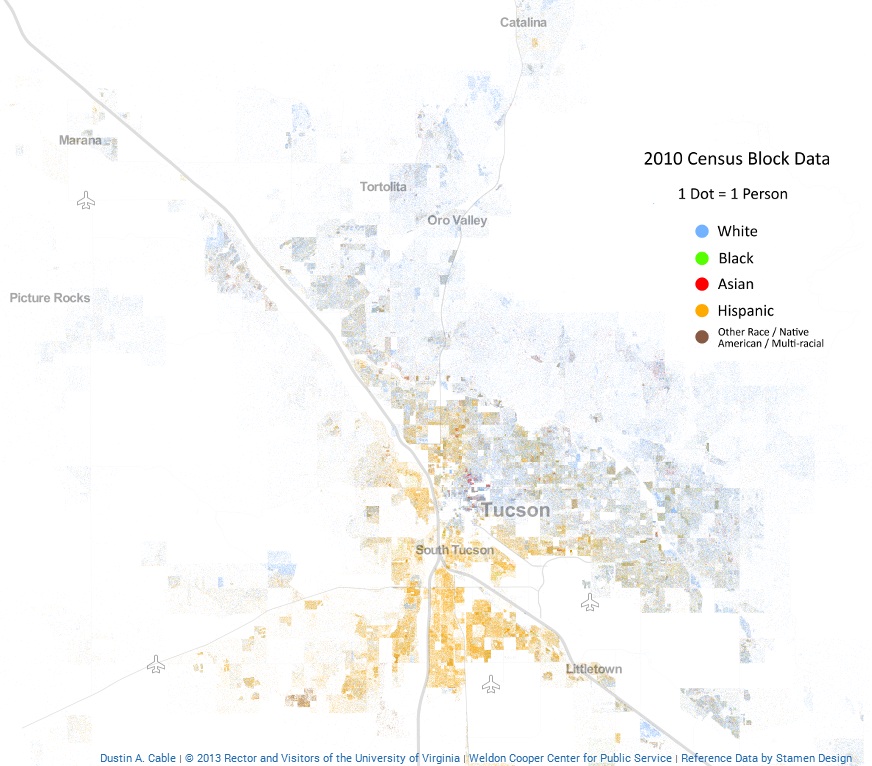
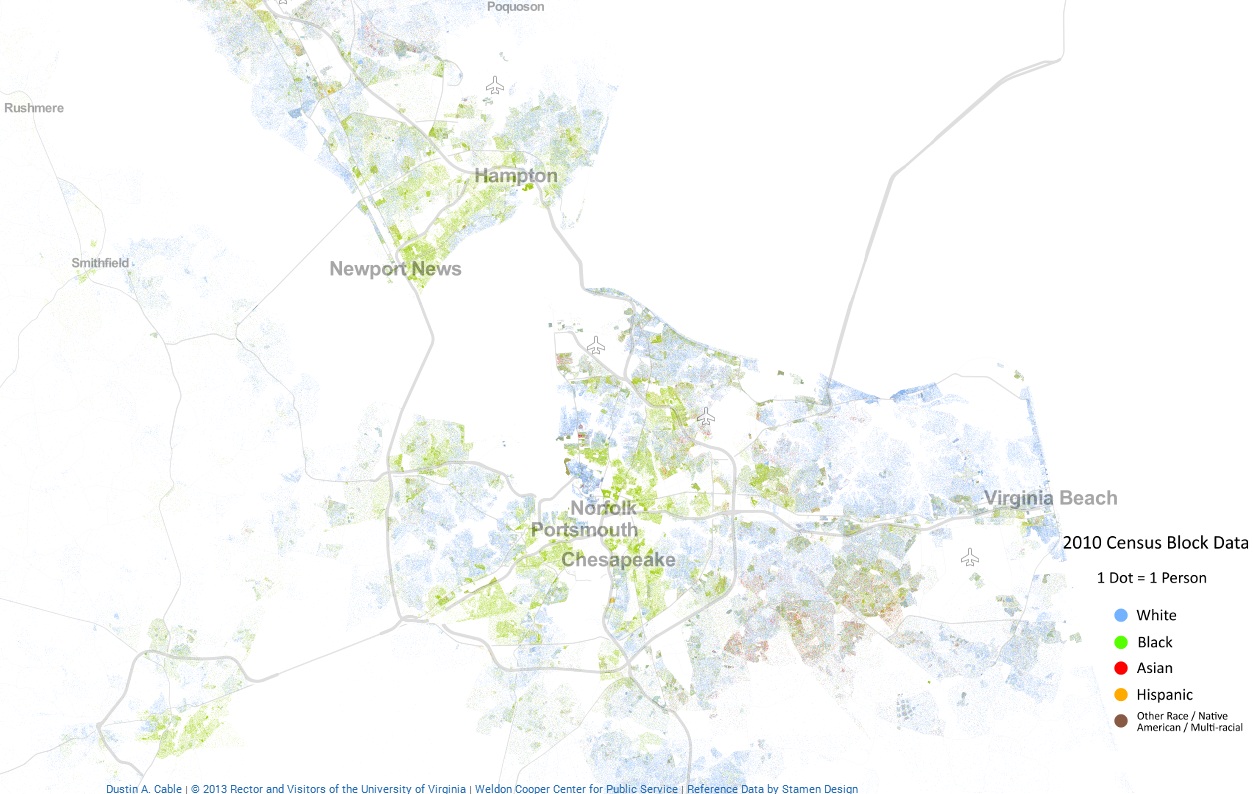
This map is an American snapshot; it provides an accessible visualization of geographic distribution, population density, and racial diversity of the American people in every neighborhood in the entire country. The map displays 308,745,538 dots, one for each person residing in the United States at the location they were counted during the 2010 Census. Each dot is color-coded by the individual’s race and ethnicity. The map is presented in both black and white and full color versions. In the color version, each dot is color-coded by race.
All of the data displayed on the map are from the U.S. Census Bureau’s 2010 Summary File 1 dataset made publicly available through the National Historical Geographic Information System. The data is based on the “census block,” the smallest area of geography for which data is collected (roughly equivalent to a city block in an urban area).
The map was created by Dustin Cable, a demographic researcher at the University of Virginia’s Weldon Cooper Center for Public Service. Brandon Martin-Anderson from the MIT Media Lab deserves credit for the original inspiration for the project. This map builds on his work by adding the Census Bureau’s racial data, and by correcting for mapping errors.
The Dots
Each of the 308 million dots are smaller than a pixel on your computer screen at most zoom levels. Therefore, the “smudges” you see at the national and regional levels are actually aggregations of many individual dots. The dots themselves are only resolvable at the city and neighborhood zoom levels.
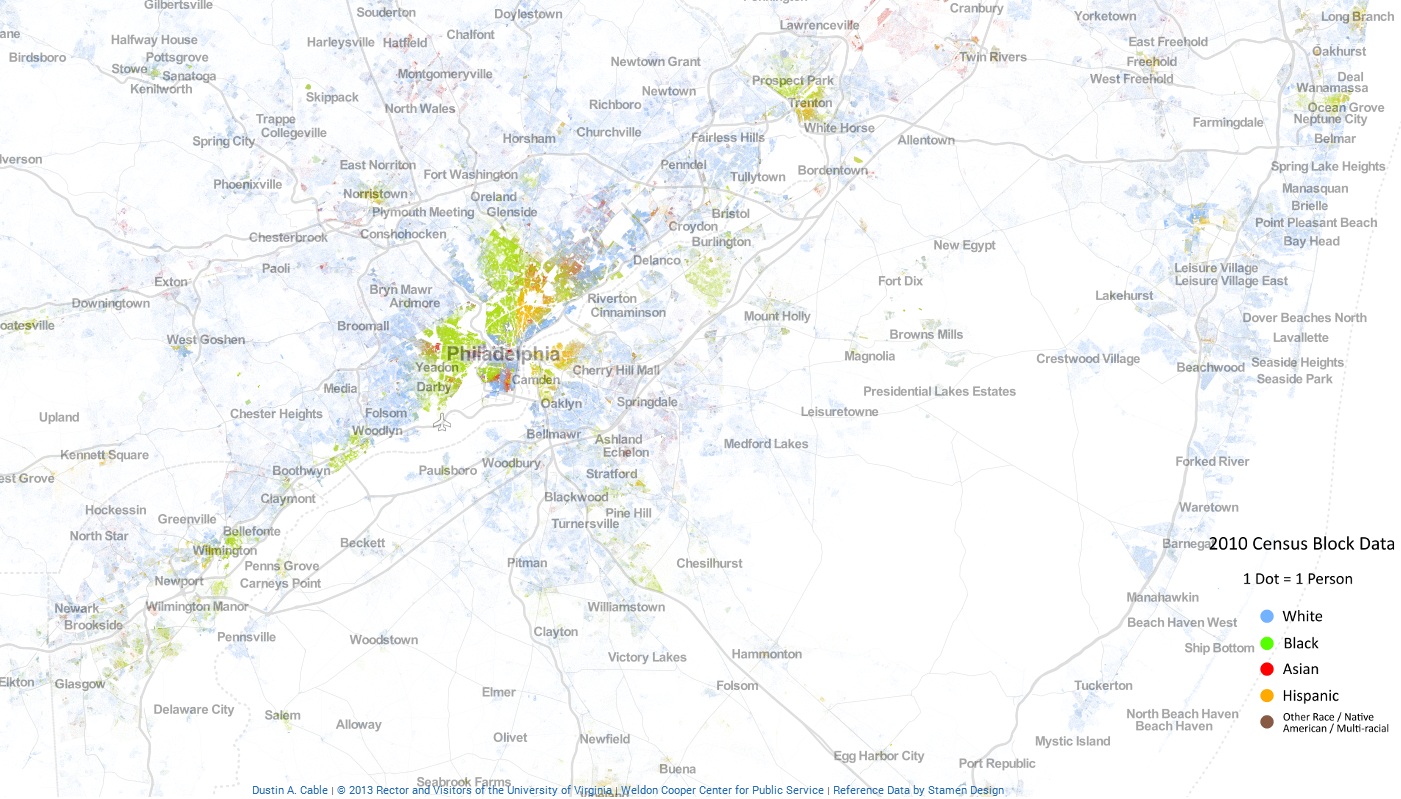
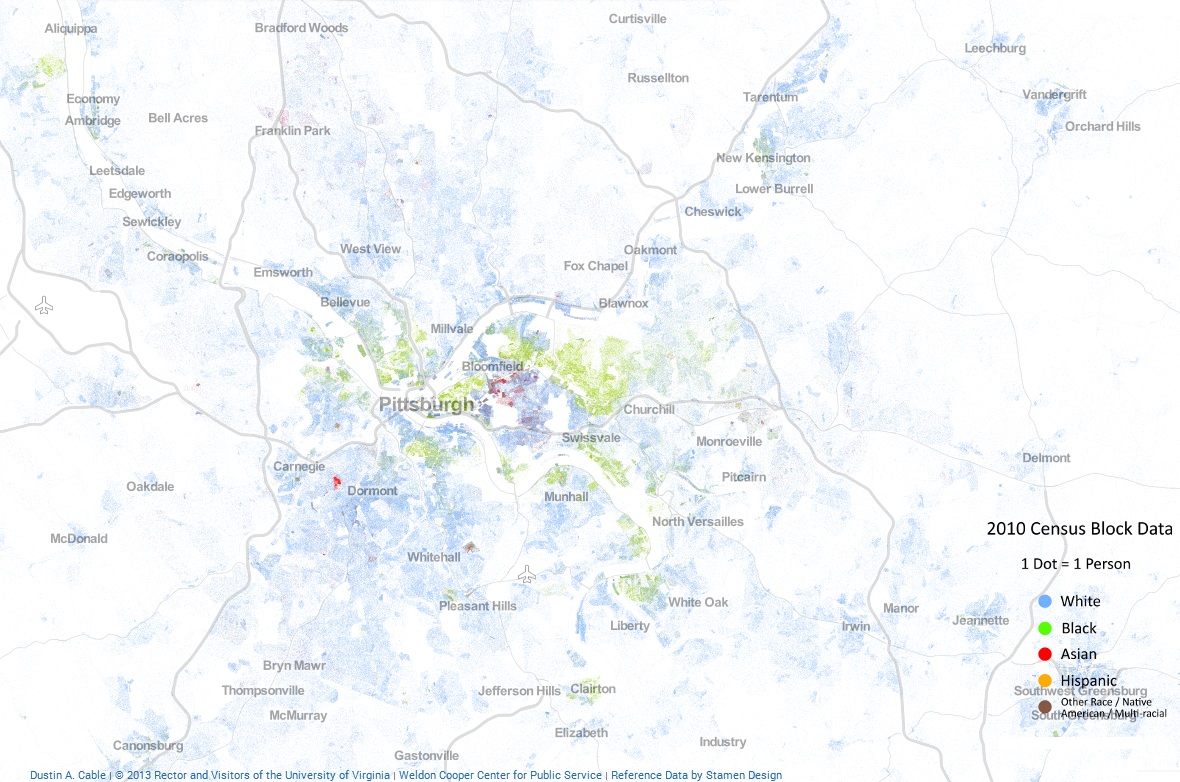
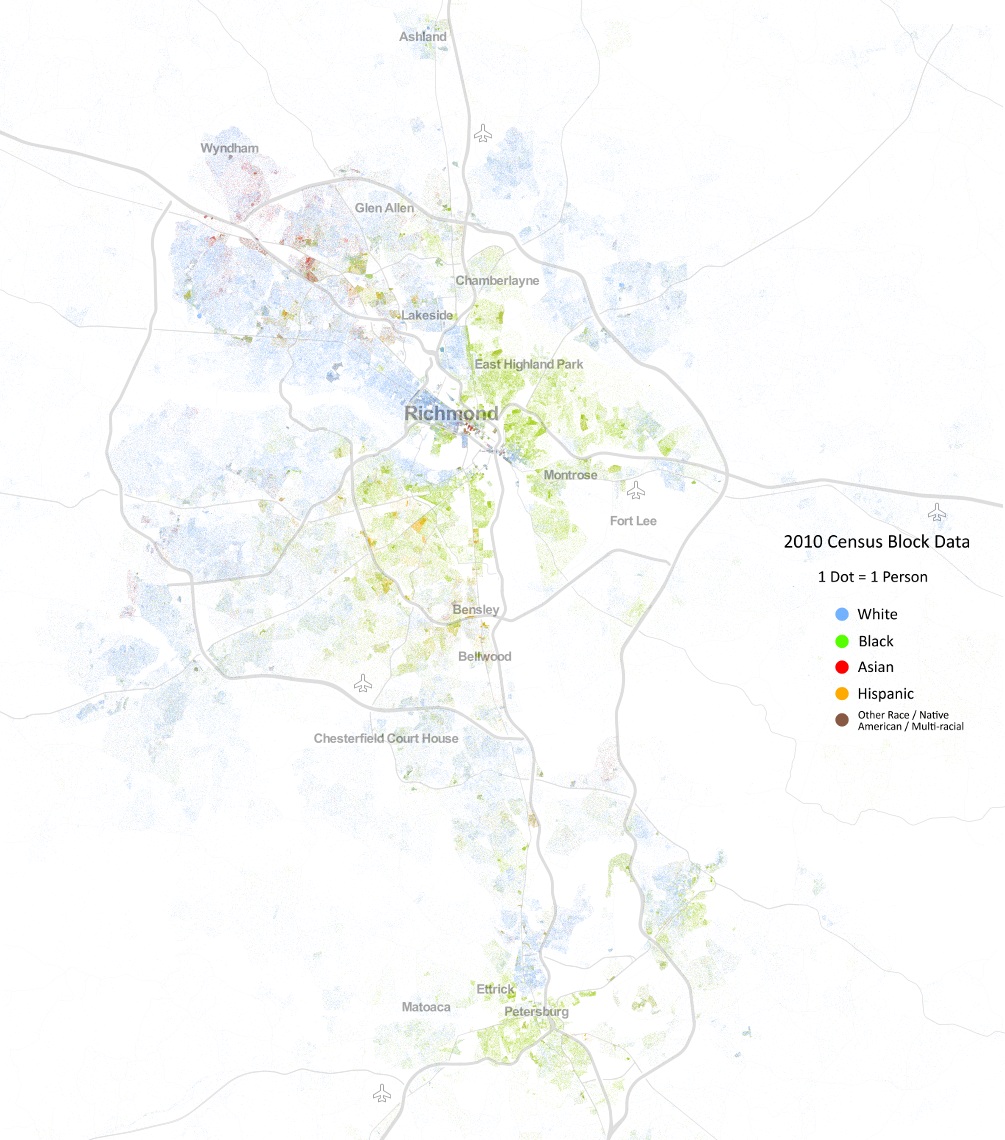
Each dot on the map is also color-coded by race and ethnicity. Whites are coded as blue; African-Americans, green; Asians, red; Hispanics, orange; and all other racial categories are coded as brown.
The University of Virginia’s Weldon Cooper Center for Public Service is a research and training organization focused on the Commonwealth of Virginia. The Center provides objective information, data, applied research, technical assistance, and practical training to state and local officials, community leaders, and members of the general public.
The Racial Dot Map
One Dot Per Person for the Entire United States
Created by Dustin Cable, July 2013
http://demographics.coopercenter.org/DotMap/index.html
Click images to enlarge. Click your back arrow to return to Dilemma X
Albuquerque

_______________________________
Atlanta
_______________________________
Austin
_______________________________
Birmingham
_______________________________
Boston
_______________________________
Buffalo
_______________________________
Charleston
_______________________________
Charlotte
_______________________________
Chicago
_______________________________
Cincinnati

_______________________________
Cleveland
_______________________________
Columbia

_______________________________
Columbus

_______________________________
Dallas-Fort Worth
_______________________________
Dayton

_______________________________
Denver

_______________________________
Des Moines
_______________________________
Detroit
_______________________________
El Paso

_______________________________
Greensboro/Winston-Salem
_______________________________
Hartford
_______________________________
Houston

_______________________________
Huntsville
_______________________________
Indianapolis

_______________________________
Jackson

_______________________________
Jacksonville

_______________________________
Kansas City
_______________________________
Las Vegas
_______________________________
Los Angeles
_______________________________
Memphis

_______________________________
Miami-Fort Lauderdale-West Palm Beach

_______________________________
Milwaukee

_______________________________
Minneapolis-Saint Paul
_______________________________
Montgomery
_______________________________
Nashville
_______________________________
New Orleans

_______________________________
New York City

_______________________________
Oklahoma City

_______________________________
Orlando

_______________________________
Philadelphia
_______________________________
Phoenix

_______________________________
Pittsburgh
_______________________________
Portland

_______________________________
Providence

_______________________________
Raleigh-Durham

______________________________
Richmond
_______________________________
Rochester
_______________________________
Sacramento

_______________________________
Sacramento

_______________________________
San Diego
_______________________________
San Francisco-Oakland-San Jose
_______________________________
Seattle
_______________________________
Saint Louis
_______________________________
Tampa-St. Petersburg-Clearwater

_______________________________
Tulsa

_______________________________
Tucson
_______________________________
Virginia Beach-Norfolk
_______________________________
Washington-Baltimore

_______________________________


September 21, 2013 at 2:33 am
Thank you for posting this.