Australia’s population forecast to double by 2075
‘Melbourne and Sydney should be neck and neck by 2053, with 7.9 million people each,’ says bureau of statistics
Australian Bureau of Statistics
Australia’s population is projected to double to 46 million by 2075, according to the latest population projections released today by the Australian Bureau of Statistics (ABS).
“Based on our projections, with medium growth, Australia will double its population by the year 2075,” said Bjorn Jarvis, Director of Demography at the ABS, “but under our high and low scenarios it could be as early as 2058, or after 2101.”
“Highlights from the ABS projections include Perth overtaking Brisbane in 2028, at three million people, and then ten years later, the Australian Capital Territory overtaking Tasmania.
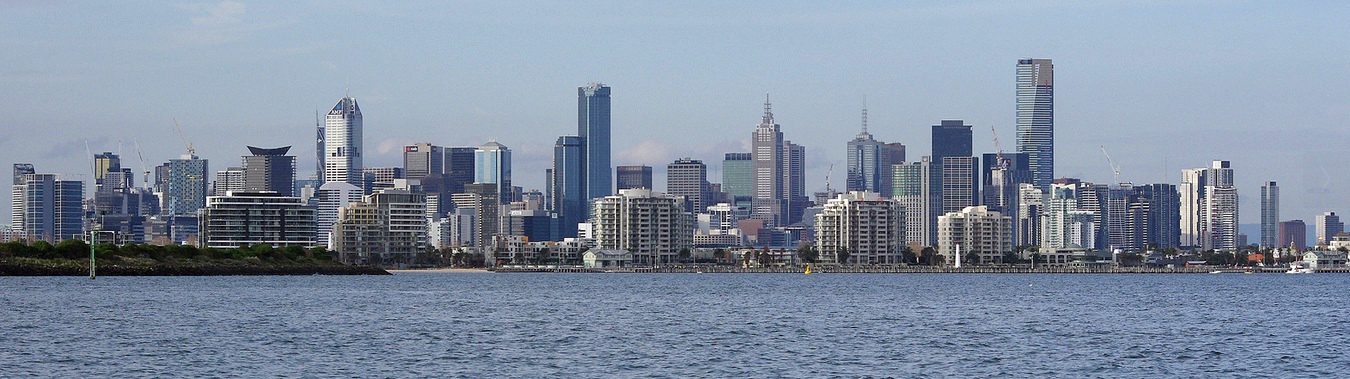
“Melbourne and Sydney should be neck and neck by 2053, with 7.9 million people each.”
“By 2040, Western Australia’s population is projected to almost double in size, from 2.4 million people in 2012 to 4.7 million. Queensland will have gone from 4.6 million people to 7.3 million, and the Australian Capital Territory will have grown from 375,000 people to 586,000.
The population of the Northern Territory is projected to grow from 240,000 people in 2012 to 360,000 people in 2040 (a 51 per cent increase), Victoria 5.6 million to 8.4 million (50 per cent), New South Wales 7.3 million to 9.9 million (35 per cent), South Australia 1.7 million to 2.1 million (26 per cent) and Tasmania 510,000 to 570,000 (11 per cent). Tasmania’s population is projected to level out by around 2040 and then fall slightly from 2047 onwards.
Population projections are based on assumptions of future levels of fertility, life expectancy and migration, which are guided by recent population trends.
“The ageing of Australia’s population as a result of sustained low fertility, combined with increasing life expectancy is likely to continue. In 2012 Australia’s median age was 37 years old; by 2040 it could be 40.5 years.” said Mr Jarvis.
In addition, the number of people 65 and over is projected to double, from 3.2 million people, (14 percent of the population) in 2012 to 6.8 million (20 percent) by 2040.
Similarly, the number of people aged 85 years and over is projected to almost triple by 2040, increasing by 770,000 people to reach 1.2 million in 2040. By then, people aged 85 years or over will make up four per cent of Australia’s population, compared to only two per cent in 2012.
______________________________
Projections
The population projections presented in this release are not predictions or forecasts. They are an assessment of what would happen to Australia’s population if the assumed levels of the components of population change-births, deaths and migration-were to occur over the next 50 to 100 years.
The projections reveal the size, structure and distribution of the future population under various assumptions on future levels of fertility, mortality and migration. These assumptions are based on long and short-term trends and future scenarios dictated by research in Australia and elsewhere.
Population size
Australia’s population at 30 June 2012 of 22.7 million is projected to increase to between 36.8 million and 48.3 million in 2061, and reach between 42.4 million and 70.1 million in 2101.
The three main series project continuing population growth throughout the projection period.
In Series A, Australia experiences strong and consistent growth, reaching 48.3 million in 2061 and 70.1 million in 2101.
In Series B, the population will reach 41.5 million in 2061 and 53.6 million in 2101.
In Series C, growth is projected to be lower, with the population reaching 36.8 million in 2061 and 42.4 million in 2101.
- Series A – assumes the TFR will reach 2.0 babies per woman by 2026 and then remain constant, life expectancy at birth will continue to increase until 2061 (reaching 92.1 years for males and 93.6 years for females), NOM will reach 280,000 by 2021 and then remain constant, and large interstate migration flows.
- Series B – assumes the TFR will decrease to 1.8 babies per woman by 2026 and then remain constant, life expectancy at birth will continue to increase each year until 2061, though at a declining rate (reaching 85.2 years for males and 88.3 years for females), NOM will remain constant at 240,000 per year throughout the projection period, and medium interstate migration flows.
- Series C – assumes the TFR will decrease to 1.6 babies per woman by 2026 and then remain constant, life expectancy at birth will continue to increase each year until 2061, though at a declining rate (reaching 85.2 years for males and 88.3 years for females), NOM will reach 200,000 per year by 2021 and then remain constant, and small interstate migration flows.
_____________________
NEW SOUTH WALES
Population size
Of the three main series, Series A projects the largest population for New South Wales, increasing from 7.3 million people at 30 June 2012 to 12.6 million in 2061. Series B projects an increase to 11.5 million people, while the smallest population of the three main series is projected in Series C (10.8 million people).
Most of New South Wales’ growth is projected to occur in Sydney, where the population is projected to increase from 4.7 million at 30 June 2012 to between 8.0 million (Series C) and 8.9 million (Series A) in 2061.
Population growth for the balance of New South Wales is smaller, increasing from 2.6 million at 30 June 2012 to between 2.9 million (Series C) and 3.7 million (Series A) in 2061.
VICTORIA
Population size
Of all the main series, Series A projects the largest population for Victoria, increasing from 5.6 million at 30 June 2012 to 12.1 million in 2061. Series B projects an increase to 10.3 million people, while the smallest population (9.0 million) of the three main series is projected in Series C.
From 4.2 million at 30 June 2012, Melbourne’s population is projected to increase continuously to between 7.6 million (Series C) and 9.8 million (Series A) in 2061.
Population growth in the balance of Victoria will be smaller, rising from 1.4 million people at 30 June 2012 to between 1.4 million and 2.3 million in 2061.
QUEENSLAND
Population size
Series A projects the largest population for Queensland, increasing from 4.6 million people at 30 June 2012 to 11.1 million in 2061. Series B projects an increase to 9.3 million people, while the smallest population of the three main series is projected in Series C (7.9 million people).
SOUTH AUSTRALIA
Population size
Series A projects the largest population for South Australia, increasing from 1.7 million at 30 June 2012 to 2.6 million in 2061. Series B projects an increase to 2.3 million people, while the smallest population (2.1 million) is projected in Series C.
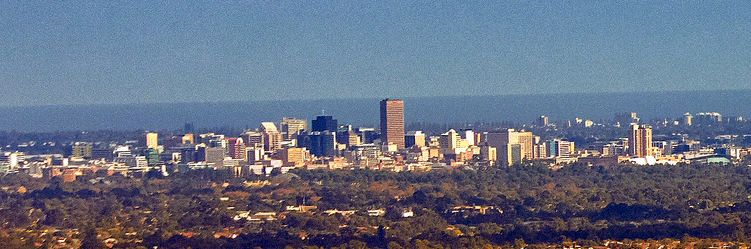
Adelaide’s population is projected to increase continuously in the three main series from 1.3 million at 30 June 2012 to between 1.7 million and 2.2 million in 2061.
In two of the three main series the population of the balance of South Australia is projected to increase, from 377,900 at 30 June 2012 to 387,400 (Series B) and 451,200 (Series A) in 2061. In Series C, the population is projected to increase marginally over the next twenty years, peaking at 398,100 in 2033, before declining to 373,700 in 2061.
WESTERN AUSTRALIA
Population size
Series A projects the largest population for Western Australia, increasing from 2.4 million at 30 June 2012 to 7.7 million in 2061. Series B projects an increase to 6.4 million people, while the smallest population is projected in Series C (5.4 million people).
Most of Western Australia’s growth is projected to occur in Perth, where the population increases continuously from 1.9 million at 30 June 2012 to between 4.4 million and 6.6 million in 2061.
Population growth in the balance of Western Australia is projected to be smaller, with Series A projecting an increase to 1.1 million people in 2061. In Series B and C, the balance of Western Australia’s population is projected to increase to 950,800 and 975,000 people (respectively) in 2061.
TASMANIA
Population size
The population of Tasmania is projected to increase in two of the three main series, and decline in the third.
Series A projects the largest population for Tasmania, increasing from 512,200 people at 30 June 2012 to 714,000 in 2061. In Series B Tasmania’s population increases slowly before levelling out by around 2046 and then decreasing marginally from 2047 onwards (565,700 people in 2061). In Series C, Tasmania’s population increases only slightly over the first 15 years and begins to decline from 2028 onwards. By 2061 Tasmania’s population is projected to be 460,900 in this scenario.
From 217,000 people at 30 June 2012, Hobart’s population is projected to increase to between 228,700 and 339,300 in 2061.
The population of the balance of Tasmania is projected to increase in Series A (from 295,400 at 30 June 2012 to 374,700 in 2061), but will decrease from 2035 onwards in Series B (reaching 295,100 in 2061) and from 2022 onwards in Series C (to 232,200 in 2061).
NORTHERN TERRITORY
Population size
Series C projects the largest population for the Northern Territory, increasing from 235,200 people at 30 June 2012 to 457,800 in 2061. Series A projects an increase to 455,700 in 2061, while the smallest population is projected in Series B (453,000).
From 131,900 people at 30 June 2012, Darwin’s population is projected to increase to between 182,000 (Series A) and 254,800 (Series C) in 2061.
Population growth in the balance of the Northern Territory will be larger, rising from 103,200 people at 30 June 2012 to between 203,000 and 273,700 in 2061.
AUSTRALIAN CAPITAL TERRITORY
Population size
Series A projects the largest population for the Australian Capital Territory, increasing from 375,100 people at 30 June 2012 to 904,100 in 2061. Series B projects an increase to 740,900 people in 2061, while the smallest population of the three main series is projected in Series C (612,400).
_____________________

Series C projects Sydney to remain the most populous city in Australia, with 8.0 million people in 2061, followed by Melbourne with 7.6 million. However, in Series A and B Melbourne is projected to become the most populous, exceeding Sydney’s population in 2030 and 2053, respectively. In 2061, Melbourne and Sydney are projected to reach a population of 8.6 and 8.5 million respectively (Series B).
Melbourne’s population exceeding Sydney’s in Series A and B is mainly due to larger levels of internal migration losses assumed for Sydney (which is assumed to have a net loss of 38,700 and 22,700 people per year respectively to the balance of Australia) compared to Melbourne (a net loss of 6,400 and 4,000 people per year respectively to the balance of Australia). For information on the assumed net internal migration for capital cities, see the Net Interstate Migration section of Chapter 2: Assumptions.

Perth is projected to experience the highest percentage growth (187%) of Australia’s capital cities, increasing from 1.9 million people at 30 June 2012 to 5.5 million in 2061 (Series B). The second highest percentage growth is projected for Brisbane, with an increase of 118%, from 2.2 million people at 30 June 2012 to 4.8 million in 2061. The population of Perth is projected to overtake that of Brisbane in around 15 years’ time, when they both reach 3 million people in 2028. Darwin’s population is projected to increase from 131,900 people at 30 June 2012 to 225,900 people in 2061 (71%).
The remaining capital cities are projected to experience smaller percentage increases, with Adelaide increasing 50% (from 1.3 million to 1.9 million) and Hobart increasing 25% (from 217,000 people to 270,700 people). The Australian Capital Territory is projected to increase by 98% (from 375,100 at 30 June 2012 to 740,900 in 2061) and overtake Tasmania’s population in 2038.
Source: Australian Bureau of Statistics


November 26, 2013
Did you know?, International