Canada releases its annual population estimates for metropolitan areas, July 1, 2014
Release date: February 11, 2015
Source: Statistics Canada
On July 1, 2014, almost 7 in 10 Canadians, or 24,858,600 people, were living in a census metropolitan area (CMA). In turn, more than one in three Canadians (35.3%) made their home in Canada’s three largest CMAs—Toronto, Montréal and Vancouver.
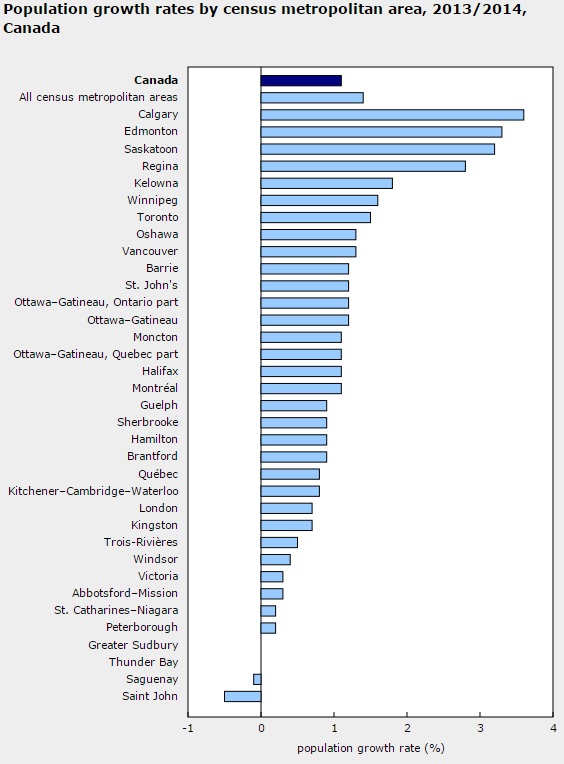
Between July 1, 2013 and June 30, 2014 (2013/2014), the population growth rate was considerably higher for Canada’s CMAs (+1.4%) than for non-CMAs (+0.4%). In comparison, for Canada as a whole, the population growth rate was 1.1% during this period. The stronger population increase in CMAs was mostly the result of higher levels of international migration in CMAs (+1.0%) compared with non-CMAs (+0.2%).
During the past year, the population of the Toronto CMA broke the 6 million threshold, reaching 6,055,700, while the population of the Montréal CMA passed the 4 million mark (4,027,100).
Population growth stronger in the Prairie census metropolitan areas
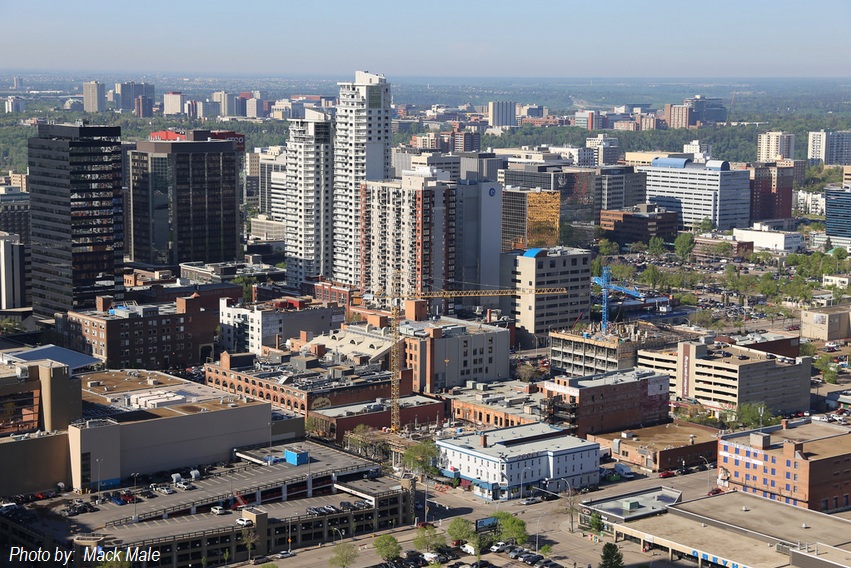
For a third consecutive year, the four fastest growing CMAs were in Alberta and Saskatchewan, with Calgary (+3.6%) reporting the largest population growth.
It was followed by the CMAs of Edmonton (+3.3%), Saskatoon (+3.2%) and Regina (+2.8%). Kelowna (+1.8%), Winnipeg (+1.6%) and Toronto (+1.5%) were the only other CMAs in the country to post population growth rates higher than the national CMA average rate (+1.4%). In contrast, Saint John (-0.5%), New Brunswick, was the lone CMA in Canada to see its population decline significantly.
_________
Annual population estimates by census metropolitan area, July 1, 2014
| Canada | 35,540,419 |
| All census metropolitan areas | 24,858,634 |
| Toronto | 6,055,724 |
| Montréal | 4,027,121 |
| Vancouver | 2,470,289 |
| Calgary | 1,406,721 |
| Edmonton | 1,328,290 |
| Ottawa–Gatineau | 1,318,122 |
| Ottawa–Gatineau, Ontario part | 989,978 |
| Ottawa–Gatineau, Quebec part | 328,144 |
| Québec | 799,632 |
| Winnipeg | 782,640 |
| Hamilton | 765,228 |
| Kitchener–Cambridge–Waterloo | 506,858 |
| London | 502,360 |
| Halifax | 414,398 |
| St. Catharines–Niagara | 405,906 |
| Oshawa | 384,143 |
| Victoria | 358,685 |
| Windsor (Located across from Detroit, US) | 333,937 |
| Saskatoon | 300,634 |
| Regina | 237,758 |
| Sherbrooke | 212,061 |
| St. John’s | 211,724 |
| Barrie | 200,416 |
| Kelowna | 191,237 |
| Abbotsford–Mission | 178,967 |
| Kingston | 168,353 |
| Greater Sudbury | 165,690 |
| Saguenay | 160,138 |
| Trois-Rivières | 155,813 |
| Guelph | 150,946 |
| Moncton | 146,073 |
| Brantford | 143,074 |
| Saint John | 127,314 |
| Thunder Bay | 125,112 |
| Peterborough | 123,270 |
______
_______
International migration the main driver of population growth in census metropolitan areas
International migration was responsible for just over two-thirds of the population growth of CMAs in 2013/2014.
All CMAs with over 1 million inhabitants reported growth rates from international migration of 1.0% or higher, accounting for most of their population growth (71%). Three CMAs with under 1 million inhabitants, all on the Prairies, had the highest rates of international migration growth: Regina (+1.9%), Saskatoon (+1.8%) and Winnipeg (+1.7%).
Toronto CMA continued to post the highest net international migration with an increase of 79,500 people, or 31% of the total for Canada. However, this proportion represented a decline from 2003/2004, when the Toronto CMA accounted for 48%. The five Prairie CMAs were the main beneficiaries of the decline in Toronto’s proportion, as their contribution to Canada’s net international migration rose from 9% to 22% in the past decade.
Interprovincial migration a key driver of the growth of Alberta’s census metropolitan areas
In most of Canada’s CMAs (28 of 34), net interprovincial migration was zero or negative in 2013/2014.
The CMAs of Calgary and Edmonton recorded the highest interprovincial migration growth rates in Canada (+1.0% each), which contributed to their strong population growth.
Interprovincial migration growth in Saint John (-1.0%) was the lowest in the country, evidence of the population decrease observed in this CMA.
____________
Toronto


Vancouver

Calgary


Edomonton


February 13, 2015
Did you know?, International