A rising share of the U.S. Black population is foreign born
9 Percent are immigrants; and while most are from the Caribbean, Africans drive recent growth
By Monica Anderson
Pew Research Center
A record 3.8 million black immigrants live in the United States today, more than four times the number in 1980, according to a Pew Research Center analysis of U.S. Census Bureau data. Black immigrants now account for 8.7% of the nation’s black population, nearly triple their share in 1980.
Rapid growth in the black immigrant population is expected to continue. The Census Bureau projects that by 2060, 16.5% of U.S. blacks will be immigrants. In certain metropolitan areas, foreign-born blacks make up a significant share of the overall black population. For example, among the metropolitan areas with the largest black populations, roughly a third of blacks (34%) living in the Miami metro area are immigrants. In the New York metro area, that share is 28%. And in the Washington, D.C., area, it is 15%.
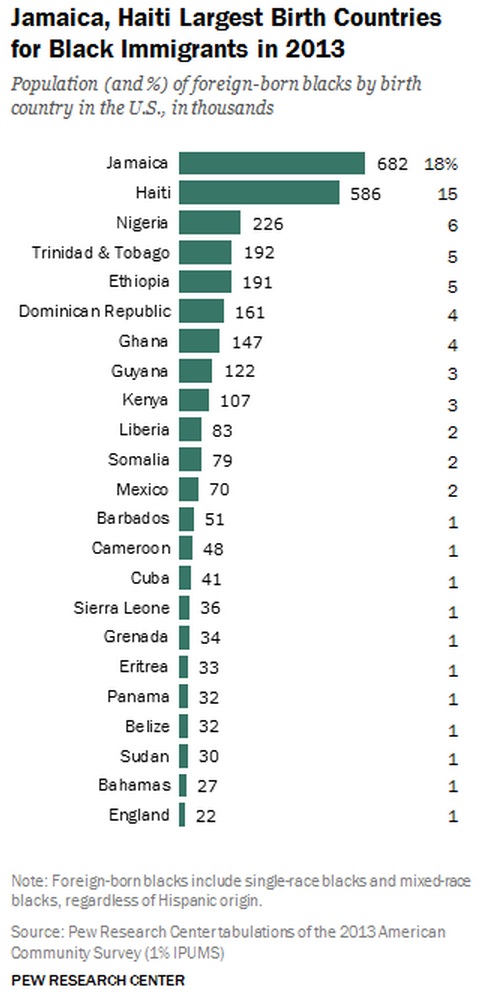
Black immigrants are from many parts of the world, but half are from the Caribbean alone.2 Jamaica is the largest source country with about 682,000 black immigrants born there, accounting for 18% of the national total. Haiti follows with 586,000 black immigrants, making up 15% of the U.S. black immigrant population.
However, much of the recent growth in the size of the black immigrant population has been fueled by African immigration. Between 2000 and 2013, the number of black African immigrants living in the U.S. rose 137%, from 574,000 to 1.4 million. Africans now make up 36% of the total foreign-born black population, up from 24% in 2000 and just 7% in 1980.
Regions of Africa
Among black immigrants from Africa, virtually all are from sub-Saharan African countries, with only 1% of all black immigrants from North Africa. Nigeria, with 226,000 immigrants, and Ethiopia, with 191,000, are the two largest birth countries for black African immigrants to the U.S.
Black immigrants have roots in other parts of the world as well. Some 5% of all black immigrants are from South America and 4% are from Central America; those from Europe make up 2% of the population and those from South and East Asia make up 1%.
Black Hispanics /Black Latinos
Many black immigrants are from Spanish-speaking countries. Among these, the Dominican Republic is the largest country of birth, accounting for 166,000 black immigrants. Mexico is also a source of black immigration with roughly 70,000 black immigrants. Some 41,000 are from Cuba, and 32,000 are Panamanian. Moreover, 11% of the foreign-born black population identifies as Hispanic.
See:
Understanding the difference between Hispanic/Latino and one’s racial classification
Understanding the difference between Hispanic/Latino and one’s racial classification
The History of Black Migration to the U.S.
The United States has long had a significant black population. In the nation’s earliest censuses (at the end of the 18th century), blacks accounted for nearly one-fifth of the U.S. population, with nearly all brought to the U.S. as enslaved Africans from Africa. Today, most of the nation’s 40 million U.S.-born blacks trace their roots to this population.
However, due to the outlawing of the slave trade in 1808 as well as restrictions on non-European immigration, the flow of blacks arriving in the U.S. dropped to a trickle for more than a century and a half. Among the black immigrants who voluntarily migrated during this time, most were from the Caribbean.
1960 immigration policy changes
The modern wave of black immigration to the U.S. began when U.S. immigration policy changed in the 1960s, becoming more open to a wider variety of migrants. Just like other immigrants, foreign-born blacks benefited from the Immigration and Nationality Act of 1965 that emphasized family reunification and skilled immigrant labor.
Refugee Act of 1980 and U.S. Immigration Act of 1990
In addition, the Refugee Act of 1980 loosened immigration restrictions by allowing more immigrants from conflict areas such as Ethiopia and Somalia to seek asylum in the U.S. Finally, the U.S. Immigration Act of 1990 sought to increase the number of immigrants from underrepresented nations, and although the act was initially intended to increase the flow of European immigrants, Africans have benefited from the program, as well.
This act, also known as the diversity visa program, has been an important way for African immigrants to gain entry into the U.S. About one-in-five sub-Saharan African immigrants (19%) who gained legal permanent residence between 2000 and 2013 entered through this program.
During the same period, about three-in-ten (28%) sub-Saharan African immigrants arrived in the U.S. as refugees or asylees. That share was only 5% for Caribbean immigrants and 13% for the overall immigrant population. Caribbean immigrants are much more likely to enter the U.S. through family-sponsored
Caribbean and sub-Saharan African immigrants are less likely to have been granted admittance via employment-based visa programs than immigrants overall (compared to those from Europe, Asia and other parts of the world).
A Statistical Portrait of Black Immigrants
When compared with U.S.-born blacks, foreign-born blacks are older, with a median age of 42 years versus 29 years for U.S.-born blacks.
Immigrant blacks ages 25 and older are also more likely than U.S.-born blacks to have a bachelor’s degree or more (26% versus 19%), less likely to live in poverty (20% versus 28%) and on average, have higher household incomes. They’re also much more likely to be married (48% among those ages 18 and older versus 28%) than U.S.-born blacks, which is likely tied to their higher median age.
Black immigrants are less likely to be in the U.S. illegally
Black immigrants share some similarities with the overall U.S. immigrant population in terms of their median ages and poverty rates. However, black immigrants are somewhat more likely to hold U.S. citizenship than all immigrants—54% versus 47%. Given that many black immigrants are from English-speaking Caribbean nations, they’re also more likely to be proficient in English compared with all immigrants (74% versus 50%). Black immigrants are also less likely to be in the U.S. illegally than all immigrants (16% versus 26%).
Compared with the U.S. population overall, black immigrants have a slightly higher median age (42 years versus 37 years) and among those that are ages 25 and up, are slightly less likely to have a college degree (26% versus 30%). In addition, black immigrants are less likely than all Americans to own their homes (40% versus 64%), and overall they have lower household incomes.
These findings are based on a Pew Research Center analysis of data from the 2013 American Community Survey in addition to analyses of the 1980, 1990 and 2000 U.S. decennial censuses. The report explores the characteristics of the nation’s black immigrant population in 2013 and how it has changed since 2000. It also compares the characteristics of black immigrants with those of U.S.-born blacks, all U.S. immigrants and the U.S. population.


Read entire Pew Research Center report
Black Immigrants 04-09-2015
_____________
Dilemma X would like to share these extra immigration statistics on all ethnic groups, races and nationalities

United States immigration statistics From 1820 to 2013
Does not include enslaved Africans
| Europe | 39,994,750 |
| North America (other nations) | 23,151,607 |
| Asia | 13,385,567 |
| South America | 2,896,962 |
| Africa | 1,783,031 |
| Oceania | 333,706 |
| Not Specified | 834,910 |
Source: U.S. Department of Homeland Security
_____
United States immigration statistics from 1860 to 1909
by country
Click image below to enlarge. Click your return arrow to return to this Dilemma X article.

____
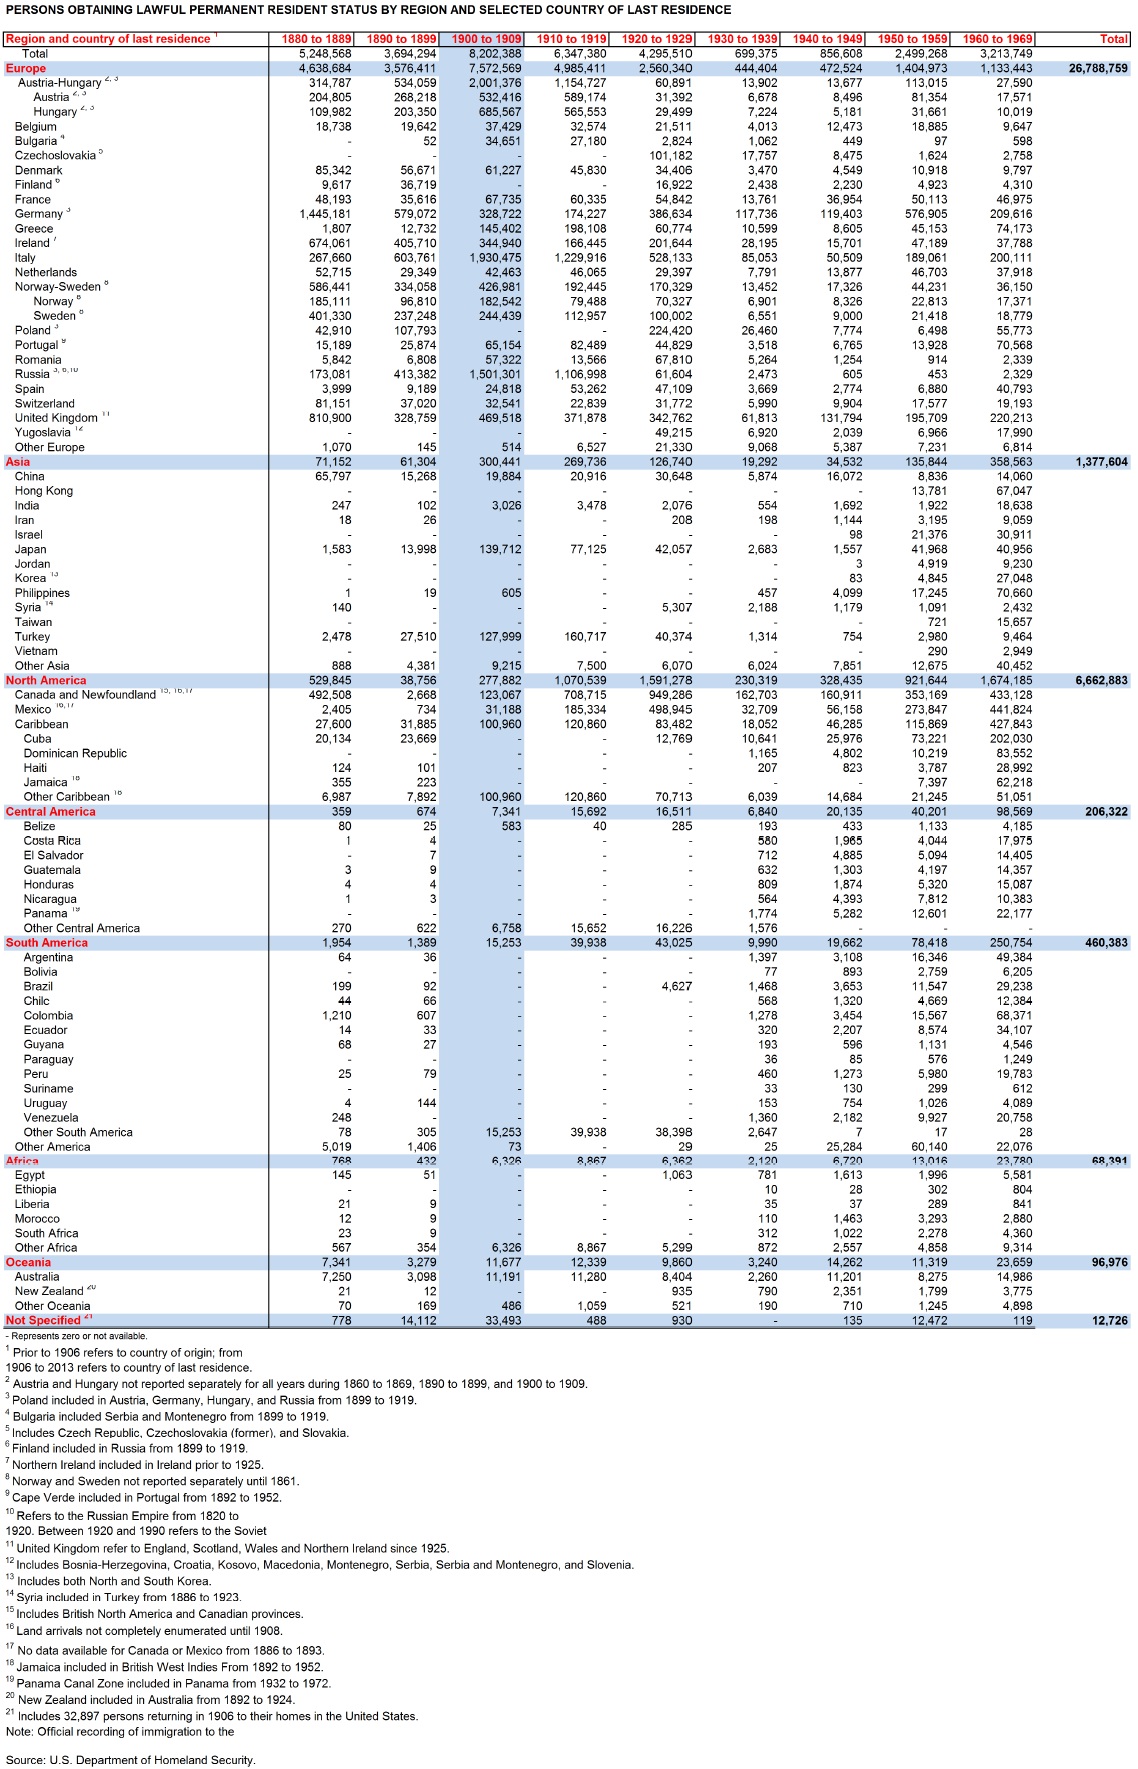
United States immigration statistics from 1880 to 1969
by country
Click image below to enlarge. Click your return arrow to return to this Dilemma X article.
____
United States immigration statistics from 1960 to 2013
by country
Click image below to enlarge. Click your return arrow to return to this Dilemma X article.

____
United States immigration statistics by state from 2004 to 2013
by country
Click image below to enlarge. Click your return arrow to return to this Dilemma X article.

____
Persons Obtaining Lawful Permanent Resident Status by Metro Area
Click image below to enlarge. Click your return arrow to return to this Dilemma X article.

____
Persons of All Nationalities, all ethnicities and races obtaining lawful permanent resident status: Fiscal Years 1820 to 2013
United States immigration statistics From 1820 to 2013


April 10, 2015
Africa, Did you know?, Government/Politics, International