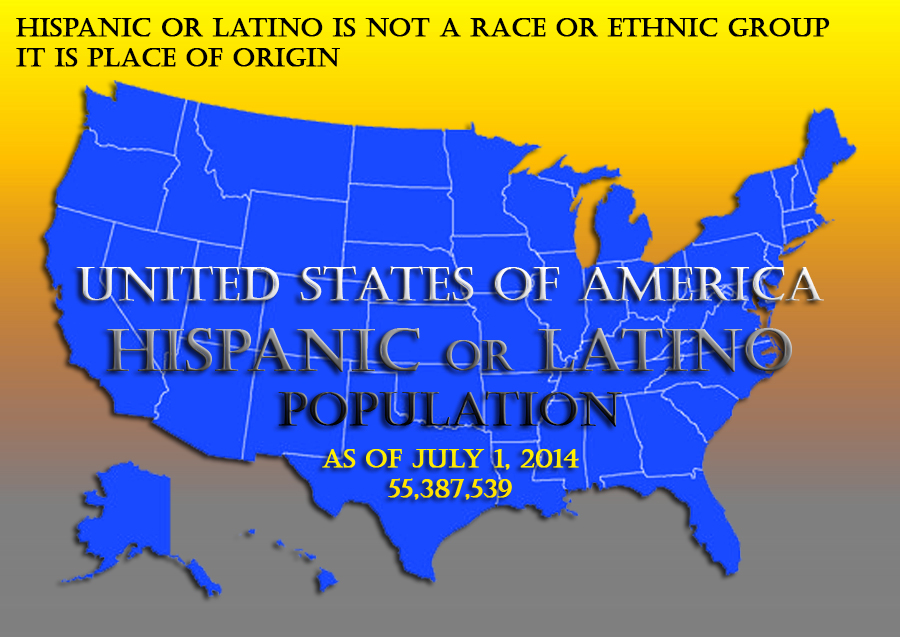
Released June 25, 2015: U.S. Hispanic or Latino population by race – America’s largest population after White is still Black or African American
In the United States the term Hispanic or Latino confuses many including demographers, those in the print media and television media. We often read that the Hispanic or Latino population is now the nations 2nd largest population after whites or that the Hispanic or Latino passed the Black or African American in population size. In fact, neither are true. What is true is the growth of the Hispanic or Latino population. But, understanding what Hispanic or Latino means is what confuses people.
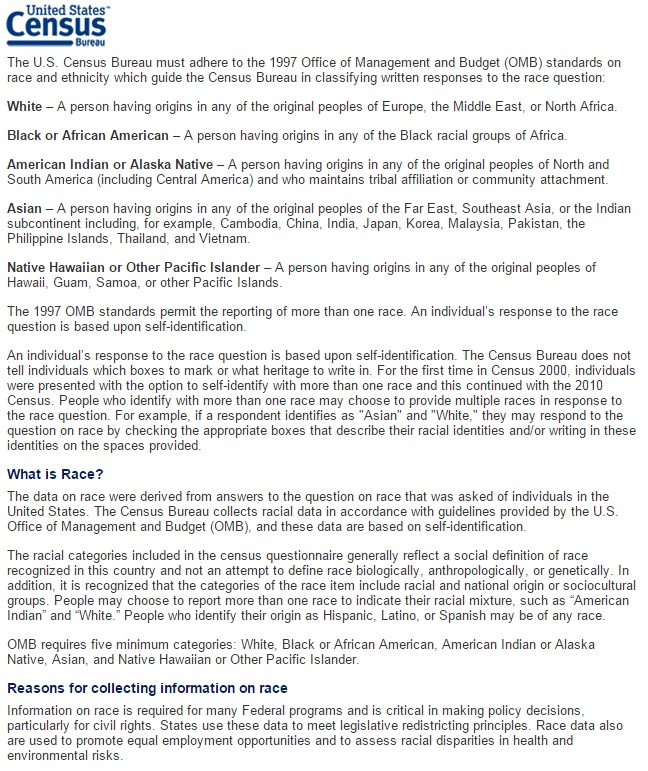
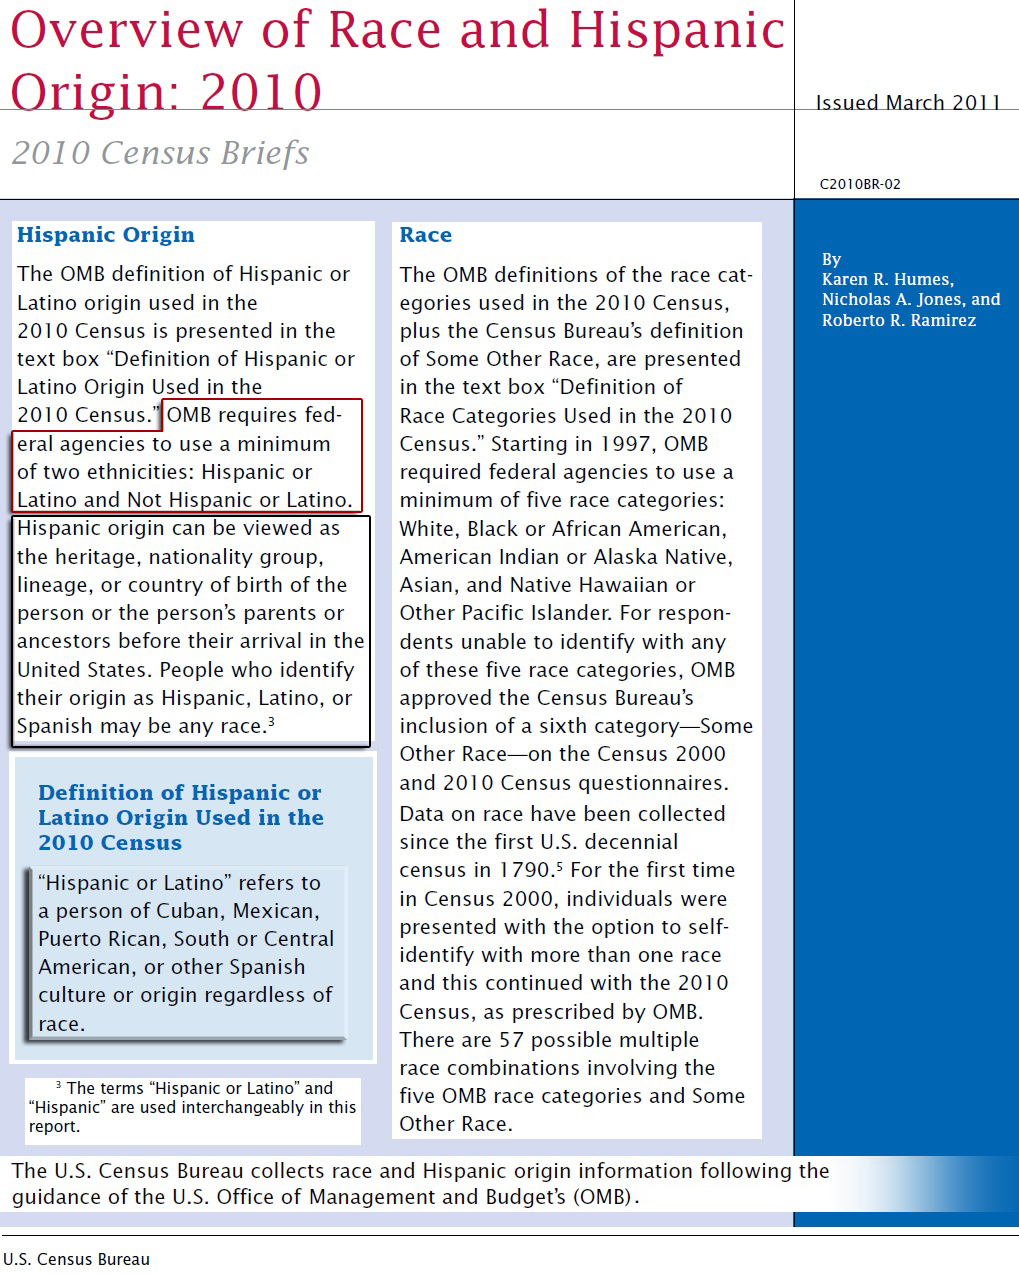
Hispanic or Latino is one of two (2) required ethnicities on the U.S. Census form by the Office of Management and Budget (OMB). The OMB is the largest office within the Executive Office of the President of the United States. The OMB requires federal agencies to use a minimum of two ethnicities: “Hispanic or Latino” and “Not Hispanic or Latino”.
Hispanic or Latino is not an “ethnic group” in the way that one may have viewed it to be. An ethnic group consist of people who are typically of the same race who also share a common and distinctive culture, religion, language, or the like.
In the case of the U.S. Census, Hispanic or Latino is instead: a heritage, nationality group, lineage, or country of birth of the person or person’s parents or ancestor before their arrival in the United States. People who identify their origin as Hispanic, Latino, or Spanish may be any race. They can identify themselves as Hispanic or Latino regardless of their race.
Hispanic or Latino refers to a person of Cuban, Mexican, Puerto Rican, South American, Central American, or Spanish culture or origin regardless of race.
An individual’s response to the race question, on the U.S. Census form, is based upon self-identification. The U.S. Census Bureau does not tell individuals which boxes to mark or what heritage to write in on their Census forms. But, they must mark either: “Hispanic or Latino” and “Not Hispanic or Latino”. They also must also mark their race as shown below:
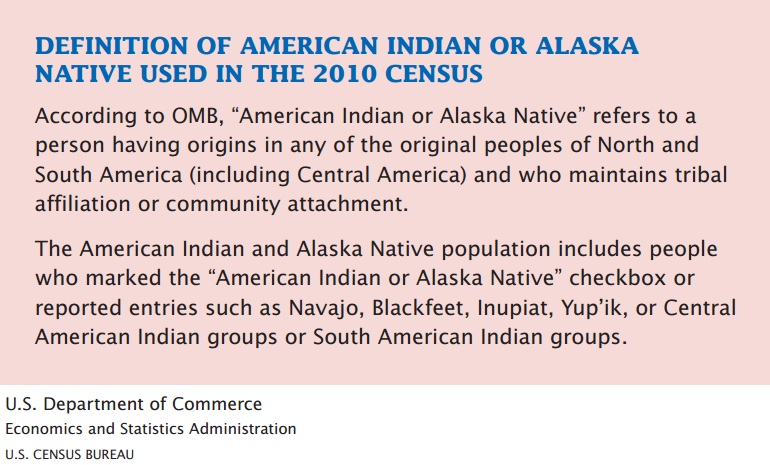
The population group that is under counted by the creation of the U.S. Census category of “Hispanic or Latino” is the American Indian or Native American or Amerindian population. Due to self-identification, on the U.S. Census forms, many people identify themselves as “White Hispanic” or “White Latino” or “Two or More Races Hispanic” or “Two or More Races Latino” instead of American Indian Hispanic or American Indian Latino Latino. This can be due to the fact that in their counties of origin these population groups self identify by their nationality rather than by their race. Race definitions in other North American (Mexico, Canada the Caribbean Island), Central American and South American counties can differ from the definitions of race in the United States. Many nations such as Mexico do not completely identify their Amerindian or Native American populations as they may not include their Mestizo population (those of mixed race -White European and Amerindian) or Zambo (those of mixed race – Black African and Amerindian) population. Thus, when these people come to the United States they may not self identify as American Indian.
Also, many “Black Hispanics” or “Black Latinos” self-identify themselves as “White Hispanic” or “White Latino” or “Two or More Races Hispanic” or “Two or More Races Latino” due to the fact many of these people may have a negative connotation by identifying as “Black” in their places of origin or in the United States. These conditions can be clearly seen in the Dominican Republic or the U.S. territory of Puerto Rico.
Is there still a fear of a Black Cuba? A brief look back in history
Is there still a fear of a black Cuba? A brief look back in history
____
Learn more about the history of the terms Hispanic or Latino as used by the U.S. Census:
Understanding the difference between Hispanic/Latino and one’s racial classification
Understanding the difference between Hispanic/Latino and one’s racial classification
______
The latest estimates of population for the United States, states, and counties by age, sex, race and Hispanic origin, and for Puerto Rico Commonwealth and municipios by age and sex – for July 1, 2014 – were released June 25, 2015.
Source: U.S. Census Bureau

___________
2014 Hispanic or Latino Population
Hispanic / Latino Population Ranking By State -As of July 1, 2014
| Geography | Total Hispanic / Latino |
| United States | 55,387,539 |
| California | 14,988,768 |
| Texas | 10,411,340 |
| Florida | 4,788,869 |
| New York | 3,672,791 |
| Illinois | 2,152,974 |
| Arizona | 2,056,455 |
| New Jersey | 1,729,172 |
| Colorado | 1,135,109 |
| New Mexico | 994,151 |
| Georgia | 935,279 |
| North Carolina | 894,276 |
| Washington | 858,779 |
| Pennsylvania | 838,823 |
| Nevada | 790,034 |
| Virginia | 737,316 |
| Massachusetts | 731,206 |
| Maryland | 557,371 |
| Connecticut | 541,152 |
| Oregon | 496,789 |
| Michigan | 476,285 |
| Indiana | 432,305 |
| Ohio | 403,190 |
| Utah | 398,760 |
| Oklahoma | 381,531 |
| Wisconsin | 372,248 |
| Kansas | 329,627 |
| Tennessee | 328,979 |
| Minnesota | 277,009 |
| South Carolina | 261,752 |
| Missouri | 240,222 |
| Louisiana | 224,867 |
| Arkansas | 208,821 |
| Alabama | 200,664 |
| Idaho | 196,502 |
| Nebraska | 191,325 |
| Iowa | 173,594 |
| Kentucky | 149,006 |
| Rhode Island | 148,095 |
| Hawaii | 143,239 |
| Mississippi | 88,937 |
| Delaware | 83,325 |
| District of Columbia | 68,355 |
| Wyoming | 57,065 |
| Alaska | 50,178 |
| New Hampshire | 43,544 |
| Montana | 35,362 |
| South Dakota | 30,537 |
| West Virginia | 26,847 |
| North Dakota | 23,439 |
| Maine | 20,165 |
| Vermont | 11,110 |
____
Hispanic / Latino Population By Race As of July 1, 2014
White Hispanic/Latino Population
| Geography | Total Hispanic / Latino | White Hispanic / Latino |
| United States | 55,387,539 | 48,790,194 |
| California | 14,988,768 | 13,475,645 |
| Texas | 10,411,340 | 9,830,569 |
| Florida | 4,788,869 | 4,382,561 |
| New York | 3,672,791 | 2,744,010 |
| Illinois | 2,152,974 | 1,961,829 |
| Arizona | 2,056,455 | 1,852,273 |
| New Jersey | 1,729,172 | 1,445,155 |
| Colorado | 1,135,109 | 1,004,390 |
| New Mexico | 994,151 | 914,782 |
| Georgia | 935,279 | 779,063 |
| North Carolina | 894,276 | 734,552 |
| Washington | 858,779 | 729,480 |
| Nevada | 790,034 | 701,427 |
| Pennsylvania | 838,823 | 640,198 |
| Virginia | 737,316 | 614,828 |
| Massachusetts | 731,206 | 563,436 |
| Maryland | 557,371 | 444,851 |
| Connecticut | 541,152 | 444,375 |
| Oregon | 496,789 | 430,260 |
| Michigan | 476,285 | 402,969 |
| Indiana | 432,305 | 381,082 |
| Utah | 398,760 | 354,835 |
| Ohio | 403,190 | 330,144 |
| Wisconsin | 372,248 | 324,388 |
| Oklahoma | 381,531 | 311,718 |
| Kansas | 329,627 | 292,830 |
| Tennessee | 328,979 | 280,903 |
| Minnesota | 277,009 | 233,559 |
| South Carolina | 261,752 | 217,025 |
| Missouri | 240,222 | 205,412 |
| Louisiana | 224,867 | 187,281 |
| Arkansas | 208,821 | 187,233 |
| Idaho | 196,502 | 175,302 |
| Alabama | 200,664 | 167,968 |
| Nebraska | 191,325 | 167,688 |
| Iowa | 173,594 | 154,497 |
| Kentucky | 149,006 | 127,855 |
| Rhode Island | 148,095 | 111,734 |
| Mississippi | 88,937 | 71,759 |
| Delaware | 83,325 | 66,303 |
| Hawaii | 143,239 | 52,237 |
| District of Columbia | 68,355 | 51,265 |
| Wyoming | 57,065 | 50,308 |
| New Hampshire | 43,544 | 36,657 |
| Alaska | 50,178 | 36,210 |
| Montana | 35,362 | 26,967 |
| South Dakota | 30,537 | 22,907 |
| West Virginia | 26,847 | 22,773 |
| North Dakota | 23,439 | 18,744 |
| Maine | 20,165 | 16,789 |
| Vermont | 11,110 | 9,168 |
Black Hispanic/Latino Population
| Geography | Total Hispanic / Latino | Black or African American Hispanic / Latino |
| United States | 55,387,539 | 2,630,013 |
| New York | 3,672,791 | 594,996 |
| California | 14,988,768 | 321,092 |
| Florida | 4,788,869 | 242,438 |
| Texas | 10,411,340 | 202,605 |
| New Jersey | 1,729,172 | 167,457 |
| Pennsylvania | 838,823 | 118,952 |
| Massachusetts | 731,206 | 101,535 |
| Georgia | 935,279 | 85,570 |
| North Carolina | 894,276 | 72,833 |
| Illinois | 2,152,974 | 68,421 |
| Maryland | 557,371 | 59,850 |
| Connecticut | 541,152 | 58,852 |
| Virginia | 737,316 | 57,169 |
| Arizona | 2,056,455 | 44,740 |
| Ohio | 403,190 | 37,135 |
| Michigan | 476,285 | 30,462 |
| Colorado | 1,135,109 | 27,528 |
| Nevada | 790,034 | 24,934 |
| Washington | 858,779 | 24,329 |
| South Carolina | 261,752 | 23,436 |
| Rhode Island | 148,095 | 21,576 |
| Indiana | 432,305 | 20,946 |
| Louisiana | 224,867 | 19,935 |
| Tennessee | 328,979 | 19,330 |
| Wisconsin | 372,248 | 16,553 |
| Alabama | 200,664 | 14,681 |
| New Mexico | 994,151 | 14,068 |
| Oklahoma | 381,531 | 12,813 |
| Missouri | 240,222 | 12,328 |
| Minnesota | 277,009 | 11,258 |
| Kansas | 329,627 | 10,909 |
| District of Columbia | 68,355 | 10,252 |
| Oregon | 496,789 | 10,063 |
| Delaware | 83,325 | 9,580 |
| Mississippi | 88,937 | 9,264 |
| Kentucky | 149,006 | 9,105 |
| Utah | 398,760 | 8,604 |
| Arkansas | 208,821 | 6,907 |
| Nebraska | 191,325 | 4,940 |
| Iowa | 173,594 | 4,837 |
| Hawaii | 143,239 | 3,316 |
| New Hampshire | 43,544 | 3,072 |
| Alaska | 50,178 | 2,649 |
| Idaho | 196,502 | 2,348 |
| West Virginia | 26,847 | 1,744 |
| Wyoming | 57,065 | 1,014 |
| Maine | 20,165 | 962 |
| South Dakota | 30,537 | 765 |
| North Dakota | 23,439 | 745 |
| Vermont | 11,110 | 570 |
| Montana | 35,362 | 545 |
American Indian and Alaska Native Hispanic / Latino
| Geography | Total Hispanic / Latino | American Indian and Alaska Native Hispanic / Latino |
| United States | 55,387,539 | 1,611,048 |
| California | 14,988,768 | 479,967 |
| Texas | 10,411,340 | 185,913 |
| New York | 3,672,791 | 131,887 |
| Arizona | 2,056,455 | 85,409 |
| Illinois | 2,152,974 | 56,327 |
| Colorado | 1,135,109 | 50,333 |
| Florida | 4,788,869 | 47,789 |
| North Carolina | 894,276 | 41,782 |
| Washington | 858,779 | 40,894 |
| New Jersey | 1,729,172 | 40,096 |
| New Mexico | 994,151 | 37,964 |
| Oklahoma | 381,531 | 32,197 |
| Georgia | 935,279 | 27,702 |
| Oregon | 496,789 | 26,362 |
| Pennsylvania | 838,823 | 26,284 |
| Virginia | 737,316 | 23,042 |
| Nevada | 790,034 | 21,864 |
| Massachusetts | 731,206 | 20,307 |
| Maryland | 557,371 | 18,907 |
| Utah | 398,760 | 15,968 |
| Michigan | 476,285 | 14,834 |
| Minnesota | 277,009 | 13,901 |
| Wisconsin | 372,248 | 13,676 |
| Indiana | 432,305 | 11,315 |
| Tennessee | 328,979 | 11,303 |
| Kansas | 329,627 | 11,160 |
| Connecticut | 541,152 | 10,987 |
| Nebraska | 191,325 | 10,231 |
| Idaho | 196,502 | 9,674 |
| Ohio | 403,190 | 9,596 |
| South Carolina | 261,752 | 8,268 |
| Missouri | 240,222 | 7,253 |
| Alabama | 200,664 | 6,887 |
| Arkansas | 208,821 | 6,590 |
| Iowa | 173,594 | 6,096 |
| Louisiana | 224,867 | 5,903 |
| Rhode Island | 148,095 | 5,487 |
| Alaska | 50,178 | 4,684 |
| Montana | 35,362 | 4,666 |
| South Dakota | 30,537 | 4,642 |
| Kentucky | 149,006 | 3,710 |
| Delaware | 83,325 | 3,208 |
| Wyoming | 57,065 | 3,129 |
| Mississippi | 88,937 | 2,982 |
| Hawaii | 143,239 | 2,651 |
| North Dakota | 23,439 | 2,403 |
| District of Columbia | 68,355 | 2,237 |
| New Hampshire | 43,544 | 1,029 |
| Maine | 20,165 | 618 |
| West Virginia | 26,847 | 576 |
| Vermont | 11,110 | 358 |
| Geography | Total Hispanic / Latino | Asian Hispanic / Latino |
| United States | 55,387,539 | 552,333 |
| California | 14,988,768 | 235,758 |
| Texas | 10,411,340 | 46,455 |
| New York | 3,672,791 | 37,717 |
| Florida | 4,788,869 | 20,837 |
| Arizona | 2,056,455 | 17,631 |
| Hawaii | 143,239 | 16,360 |
| Illinois | 2,152,974 | 15,928 |
| New Jersey | 1,729,172 | 14,843 |
| Washington | 858,779 | 13,889 |
| Nevada | 790,034 | 11,846 |
| Virginia | 737,316 | 9,101 |
| Colorado | 1,135,109 | 8,865 |
| North Carolina | 894,276 | 8,678 |
| Pennsylvania | 838,823 | 8,358 |
| Georgia | 935,279 | 8,236 |
| Maryland | 557,371 | 6,613 |
| Massachusetts | 731,206 | 6,244 |
| Oregon | 496,789 | 5,076 |
| New Mexico | 994,151 | 4,891 |
| Connecticut | 541,152 | 4,046 |
| Michigan | 476,285 | 3,738 |
| Ohio | 403,190 | 3,618 |
| Utah | 398,760 | 3,570 |
| Minnesota | 277,009 | 3,223 |
| Indiana | 432,305 | 3,088 |
| Tennessee | 328,979 | 3,051 |
| Wisconsin | 372,248 | 2,790 |
| Oklahoma | 381,531 | 2,754 |
| Missouri | 240,222 | 2,401 |
| South Carolina | 261,752 | 2,374 |
| Kansas | 329,627 | 2,260 |
| Louisiana | 224,867 | 2,120 |
| Alabama | 200,664 | 1,493 |
| Idaho | 196,502 | 1,488 |
| Arkansas | 208,821 | 1,486 |
| Kentucky | 149,006 | 1,471 |
| Nebraska | 191,325 | 1,362 |
| Iowa | 173,594 | 1,339 |
| Rhode Island | 148,095 | 1,329 |
| Alaska | 50,178 | 1,276 |
| District of Columbia | 68,355 | 920 |
| Mississippi | 88,937 | 715 |
| Delaware | 83,325 | 582 |
| Wyoming | 57,065 | 429 |
| New Hampshire | 43,544 | 425 |
| Montana | 35,362 | 389 |
| Maine | 20,165 | 371 |
| West Virginia | 26,847 | 277 |
| North Dakota | 23,439 | 234 |
| South Dakota | 30,537 | 227 |
| Vermont | 11,110 | 161 |
| Geography | Total Hispanic / Latino | Native Hawaiian and Other Pacific Islander Hispanic / Latino |
| United States | 55,387,539 | 195,867 |
| California | 14,988,768 | 52,194 |
| New York | 3,672,791 | 17,514 |
| Texas | 10,411,340 | 14,825 |
| Hawaii | 143,239 | 9,733 |
| Florida | 4,788,869 | 9,336 |
| New Jersey | 1,729,172 | 5,962 |
| Georgia | 935,279 | 5,564 |
| Arizona | 2,056,455 | 5,549 |
| North Carolina | 894,276 | 5,397 |
| Pennsylvania | 838,823 | 4,932 |
| Washington | 858,779 | 4,919 |
| Illinois | 2,152,974 | 4,625 |
| Nevada | 790,034 | 4,175 |
| Massachusetts | 731,206 | 3,950 |
| Virginia | 737,316 | 3,294 |
| Maryland | 557,371 | 3,272 |
| Colorado | 1,135,109 | 3,039 |
| Alabama | 200,664 | 2,825 |
| Tennessee | 328,979 | 2,720 |
| Connecticut | 541,152 | 2,537 |
| Utah | 398,760 | 2,277 |
| Ohio | 403,190 | 2,014 |
| New Mexico | 994,151 | 1,986 |
| Oregon | 496,789 | 1,884 |
| Indiana | 432,305 | 1,846 |
| South Carolina | 261,752 | 1,831 |
| Missouri | 240,222 | 1,477 |
| Oklahoma | 381,531 | 1,432 |
| Michigan | 476,285 | 1,338 |
| Rhode Island | 148,095 | 1,139 |
| Kentucky | 149,006 | 1,128 |
| Minnesota | 277,009 | 1,108 |
| Nebraska | 191,325 | 1,095 |
| Louisiana | 224,867 | 1,087 |
| Arkansas | 208,821 | 1,066 |
| Wisconsin | 372,248 | 1,041 |
| Kansas | 329,627 | 925 |
| Mississippi | 88,937 | 742 |
| District of Columbia | 68,355 | 672 |
| Iowa | 173,594 | 647 |
| Idaho | 196,502 | 634 |
| Delaware | 83,325 | 520 |
| Alaska | 50,178 | 482 |
| New Hampshire | 43,544 | 249 |
| South Dakota | 30,537 | 221 |
| Wyoming | 57,065 | 183 |
| Montana | 35,362 | 161 |
| West Virginia | 26,847 | 113 |
| North Dakota | 23,439 | 87 |
| Maine | 20,165 | 76 |
| Vermont | 11,110 | 44 |
| Geography | Total Hispanic / Latino | Two or More Races Hispanic / Latino |
| United States | 55,387,539 | 1,608,084 |
| California | 14,988,768 | 424,112 |
| New York | 3,672,791 | 146,667 |
| Texas | 10,411,340 | 130,973 |
| Florida | 4,788,869 | 85,908 |
| Hawaii | 143,239 | 58,942 |
| New Jersey | 1,729,172 | 55,659 |
| Arizona | 2,056,455 | 50,853 |
| Illinois | 2,152,974 | 45,844 |
| Washington | 858,779 | 45,268 |
| Colorado | 1,135,109 | 40,954 |
| Pennsylvania | 838,823 | 40,099 |
| Massachusetts | 731,206 | 35,734 |
| North Carolina | 894,276 | 31,034 |
| Virginia | 737,316 | 29,882 |
| Georgia | 935,279 | 29,144 |
| Nevada | 790,034 | 25,788 |
| Maryland | 557,371 | 23,878 |
| Oregon | 496,789 | 23,144 |
| Michigan | 476,285 | 22,944 |
| Ohio | 403,190 | 20,683 |
| Oklahoma | 381,531 | 20,617 |
| New Mexico | 994,151 | 20,460 |
| Connecticut | 541,152 | 20,355 |
| Indiana | 432,305 | 14,028 |
| Minnesota | 277,009 | 13,960 |
| Wisconsin | 372,248 | 13,800 |
| Utah | 398,760 | 13,506 |
| Tennessee | 328,979 | 11,672 |
| Kansas | 329,627 | 11,543 |
| Missouri | 240,222 | 11,351 |
| South Carolina | 261,752 | 8,818 |
| Louisiana | 224,867 | 8,541 |
| Idaho | 196,502 | 7,056 |
| Rhode Island | 148,095 | 6,830 |
| Alabama | 200,664 | 6,810 |
| Iowa | 173,594 | 6,178 |
| Nebraska | 191,325 | 6,009 |
| Kentucky | 149,006 | 5,737 |
| Arkansas | 208,821 | 5,539 |
| Alaska | 50,178 | 4,877 |
| Mississippi | 88,937 | 3,475 |
| Delaware | 83,325 | 3,132 |
| District of Columbia | 68,355 | 3,009 |
| Montana | 35,362 | 2,634 |
| New Hampshire | 43,544 | 2,112 |
| Wyoming | 57,065 | 2,002 |
| South Dakota | 30,537 | 1,775 |
| West Virginia | 26,847 | 1,364 |
| Maine | 20,165 | 1,349 |
| North Dakota | 23,439 | 1,226 |
| Vermont | 11,110 | 809 |
____
Total State Populations By Race As of July 1, 2014
White Population -As of July 1, 2014
| Geography | Total | White |
| United States | 318,857,056 | 246,660,710 |
| California | 38,802,500 | 28,395,830 |
| Texas | 26,956,958 | 21,565,643 |
| Florida | 19,893,297 | 15,485,874 |
| New York | 19,746,227 | 13,906,584 |
| Pennsylvania | 12,787,209 | 10,598,587 |
| Illinois | 12,880,580 | 9,984,775 |
| Ohio | 11,594,163 | 9,618,404 |
| Michigan | 9,909,877 | 7,915,690 |
| North Carolina | 9,943,964 | 7,108,057 |
| New Jersey | 8,938,175 | 6,526,416 |
| Georgia | 10,097,343 | 6,266,166 |
| Virginia | 8,326,289 | 5,872,210 |
| Washington | 7,061,530 | 5,699,754 |
| Indiana | 6,596,855 | 5,678,447 |
| Arizona | 6,731,484 | 5,636,322 |
| Massachusetts | 6,745,408 | 5,574,178 |
| Tennessee | 6,549,352 | 5,169,234 |
| Missouri | 6,063,589 | 5,063,452 |
| Wisconsin | 5,757,564 | 5,057,797 |
| Colorado | 5,355,866 | 4,699,302 |
| Minnesota | 5,457,173 | 4,677,716 |
| Kentucky | 4,413,457 | 3,895,463 |
| Maryland | 5,976,407 | 3,589,555 |
| Oregon | 3,970,239 | 3,488,798 |
| Alabama | 4,849,377 | 3,377,605 |
| South Carolina | 4,832,482 | 3,302,736 |
| Louisiana | 4,649,676 | 2,945,869 |
| Connecticut | 3,596,677 | 2,919,746 |
| Oklahoma | 3,878,051 | 2,910,952 |
| Iowa | 3,107,126 | 2,860,661 |
| Utah | 2,942,902 | 2,689,846 |
| Kansas | 2,904,021 | 2,521,932 |
| Arkansas | 2,966,369 | 2,364,132 |
| Nevada | 2,839,099 | 2,163,454 |
| Mississippi | 2,994,079 | 1,786,028 |
| West Virginia | 1,850,326 | 1,734,220 |
| New Mexico | 2,085,572 | 1,726,182 |
| Nebraska | 1,881,503 | 1,682,074 |
| Idaho | 1,634,464 | 1,528,744 |
| Maine | 1,330,089 | 1,263,864 |
| New Hampshire | 1,326,813 | 1,247,714 |
| Montana | 1,023,579 | 914,674 |
| Rhode Island | 1,055,173 | 898,297 |
| South Dakota | 853,175 | 731,359 |
| Delaware | 935,614 | 662,176 |
| North Dakota | 739,482 | 659,128 |
| Vermont | 626,562 | 595,181 |
| Wyoming | 584,153 | 541,596 |
| Alaska | 736,732 | 492,522 |
| Hawaii | 1,419,561 | 378,323 |
| District of Columbia | 658,893 | 287,441 |
Black or African American Population -As of July 1, 2014
| Geography | Total | Black or African American |
| United States | 318,857,056 | 42,158,238 |
| New York | 19,746,227 | 3,479,242 |
| Texas | 26,956,958 | 3,364,416 |
| Florida | 19,893,297 | 3,337,159 |
| Georgia | 10,097,343 | 3,183,784 |
| California | 38,802,500 | 2,541,367 |
| North Carolina | 9,943,964 | 2,196,390 |
| Illinois | 12,880,580 | 1,892,255 |
| Maryland | 5,976,407 | 1,809,294 |
| Virginia | 8,326,289 | 1,638,835 |
| Louisiana | 4,649,676 | 1,510,676 |
| Pennsylvania | 12,787,209 | 1,484,746 |
| Ohio | 11,594,163 | 1,463,594 |
| Michigan | 9,909,877 | 1,410,458 |
| South Carolina | 4,832,482 | 1,342,308 |
| New Jersey | 8,938,175 | 1,321,105 |
| Alabama | 4,849,377 | 1,293,200 |
| Mississippi | 2,994,079 | 1,122,938 |
| Tennessee | 6,549,352 | 1,119,119 |
| Missouri | 6,063,589 | 714,595 |
| Indiana | 6,596,855 | 630,754 |
| Massachusetts | 6,745,408 | 558,072 |
| Arkansas | 2,966,369 | 463,360 |
| Connecticut | 3,596,677 | 413,814 |
| Wisconsin | 5,757,564 | 378,526 |
| Kentucky | 4,413,457 | 363,239 |
| District of Columbia | 658,893 | 322,827 |
| Minnesota | 5,457,173 | 320,423 |
| Arizona | 6,731,484 | 318,202 |
| Oklahoma | 3,878,051 | 299,574 |
| Washington | 7,061,530 | 286,779 |
| Nevada | 2,839,099 | 258,492 |
| Colorado | 5,355,866 | 238,720 |
| Delaware | 935,614 | 208,081 |
| Kansas | 2,904,021 | 181,546 |
| Iowa | 3,107,126 | 106,073 |
| Nebraska | 1,881,503 | 92,289 |
| Rhode Island | 1,055,173 | 81,149 |
| Oregon | 3,970,239 | 80,962 |
| West Virginia | 1,850,326 | 67,073 |
| New Mexico | 2,085,572 | 52,666 |
| Utah | 2,942,902 | 39,655 |
| Hawaii | 1,419,561 | 34,864 |
| Alaska | 736,732 | 28,820 |
| New Hampshire | 1,326,813 | 19,686 |
| Maine | 1,330,089 | 19,149 |
| South Dakota | 853,175 | 15,971 |
| North Dakota | 739,482 | 15,555 |
| Idaho | 1,634,464 | 13,507 |
| Wyoming | 584,153 | 9,112 |
| Vermont | 626,562 | 7,709 |
| Montana | 1,023,579 | 6,108 |
American Indian and Alaska Native Population -As of July 1, 2014
| Geography | Total | American Indian and Alaska Native |
| United States | 318,857,056 | 3,960,971 |
| California | 38,802,500 | 645,309 |
| Arizona | 6,731,484 | 357,672 |
| Oklahoma | 3,878,051 | 350,892 |
| Texas | 26,956,958 | 274,452 |
| New Mexico | 2,085,572 | 217,262 |
| New York | 19,746,227 | 189,764 |
| North Carolina | 9,943,964 | 154,735 |
| Washington | 7,061,530 | 132,935 |
| Alaska | 736,732 | 108,956 |
| Florida | 19,893,297 | 99,203 |
| Colorado | 5,355,866 | 84,946 |
| South Dakota | 853,175 | 75,879 |
| Illinois | 12,880,580 | 75,293 |
| Minnesota | 5,457,173 | 71,960 |
| Michigan | 9,909,877 | 71,030 |
| Oregon | 3,970,239 | 70,842 |
| Montana | 1,023,579 | 67,065 |
| Wisconsin | 5,757,564 | 64,192 |
| New Jersey | 8,938,175 | 53,223 |
| Georgia | 10,097,343 | 50,988 |
| Nevada | 2,839,099 | 46,535 |
| Virginia | 8,326,289 | 45,725 |
| Utah | 2,942,902 | 44,551 |
| Pennsylvania | 12,787,209 | 44,142 |
| North Dakota | 739,482 | 40,277 |
| Louisiana | 4,649,676 | 35,276 |
| Kansas | 2,904,021 | 34,741 |
| Alabama | 4,849,377 | 33,772 |
| Maryland | 5,976,407 | 33,413 |
| Missouri | 6,063,589 | 32,828 |
| Massachusetts | 6,745,408 | 32,392 |
| Ohio | 11,594,163 | 31,585 |
| Tennessee | 6,549,352 | 28,845 |
| Arkansas | 2,966,369 | 28,689 |
| Idaho | 1,634,464 | 28,152 |
| Indiana | 6,596,855 | 26,354 |
| South Carolina | 4,832,482 | 25,961 |
| Nebraska | 1,881,503 | 25,690 |
| Connecticut | 3,596,677 | 18,443 |
| Mississippi | 2,994,079 | 17,520 |
| Wyoming | 584,153 | 15,541 |
| Iowa | 3,107,126 | 15,183 |
| Kentucky | 4,413,457 | 12,774 |
| Rhode Island | 1,055,173 | 9,965 |
| Maine | 1,330,089 | 9,132 |
| Hawaii | 1,419,561 | 6,356 |
| Delaware | 935,614 | 6,188 |
| West Virginia | 1,850,326 | 4,441 |
| New Hampshire | 1,326,813 | 3,849 |
| District of Columbia | 658,893 | 3,697 |
| Vermont | 626,562 | 2,356 |
Asian Population -As of July 1, 2014
| Geography | Total | Asian |
| United States | 318,857,056 | 17,339,053 |
| California | 38,802,500 | 5,586,184 |
| New York | 19,746,227 | 1,677,323 |
| Texas | 26,956,958 | 1,223,865 |
| New Jersey | 8,938,175 | 844,324 |
| Illinois | 12,880,580 | 684,715 |
| Washington | 7,061,530 | 576,147 |
| Florida | 19,893,297 | 553,820 |
| Hawaii | 1,419,561 | 532,371 |
| Virginia | 8,326,289 | 526,867 |
| Massachusetts | 6,745,408 | 425,305 |
| Pennsylvania | 12,787,209 | 417,607 |
| Georgia | 10,097,343 | 387,181 |
| Maryland | 5,976,407 | 380,168 |
| Michigan | 9,909,877 | 283,968 |
| North Carolina | 9,943,964 | 267,385 |
| Minnesota | 5,457,173 | 256,896 |
| Nevada | 2,839,099 | 236,304 |
| Ohio | 11,594,163 | 233,379 |
| Arizona | 6,731,484 | 221,347 |
| Oregon | 3,970,239 | 169,517 |
| Colorado | 5,355,866 | 168,460 |
| Connecticut | 3,596,677 | 161,770 |
| Wisconsin | 5,757,564 | 152,512 |
| Indiana | 6,596,855 | 132,406 |
| Missouri | 6,063,589 | 116,213 |
| Tennessee | 6,549,352 | 112,524 |
| Louisiana | 4,649,676 | 83,181 |
| Oklahoma | 3,878,051 | 81,394 |
| Kansas | 2,904,021 | 81,152 |
| South Carolina | 4,832,482 | 74,319 |
| Utah | 2,942,902 | 70,407 |
| Iowa | 3,107,126 | 69,062 |
| Alabama | 4,849,377 | 64,633 |
| Kentucky | 4,413,457 | 60,889 |
| Alaska | 736,732 | 44,681 |
| Arkansas | 2,966,369 | 44,193 |
| Nebraska | 1,881,503 | 41,216 |
| Rhode Island | 1,055,173 | 36,785 |
| Delaware | 935,614 | 35,093 |
| New Mexico | 2,085,572 | 34,848 |
| New Hampshire | 1,326,813 | 33,742 |
| Mississippi | 2,994,079 | 30,557 |
| District of Columbia | 658,893 | 26,480 |
| Idaho | 1,634,464 | 23,180 |
| Maine | 1,330,089 | 15,758 |
| West Virginia | 1,850,326 | 14,945 |
| South Dakota | 853,175 | 10,739 |
| Vermont | 626,562 | 9,752 |
| North Dakota | 739,482 | 9,412 |
| Montana | 1,023,579 | 8,256 |
| Wyoming | 584,153 | 5,821 |
Native Hawaiian and Other Pacific Islander Population -As of July 1, 2014
| Geography | Total | Native Hawaiian and Other Pacific Islander |
| United States | 318,857,056 | 741,601 |
| California | 38,802,500 | 194,088 |
| Hawaii | 1,419,561 | 141,286 |
| Washington | 7,061,530 | 49,986 |
| Texas | 26,956,958 | 36,632 |
| Utah | 2,942,902 | 29,046 |
| New York | 19,746,227 | 26,223 |
| Florida | 19,893,297 | 21,978 |
| Nevada | 2,839,099 | 21,140 |
| Arizona | 6,731,484 | 17,740 |
| Oregon | 3,970,239 | 16,861 |
| North Carolina | 9,943,964 | 11,930 |
| Georgia | 10,097,343 | 11,895 |
| Colorado | 5,355,866 | 10,071 |
| Virginia | 8,326,289 | 9,558 |
| Alaska | 736,732 | 9,296 |
| New Jersey | 8,938,175 | 8,917 |
| Arkansas | 2,966,369 | 8,633 |
| Missouri | 6,063,589 | 8,527 |
| Pennsylvania | 12,787,209 | 8,516 |
| Illinois | 12,880,580 | 8,193 |
| Massachusetts | 6,745,408 | 6,679 |
| Oklahoma | 3,878,051 | 6,393 |
| Maryland | 5,976,407 | 6,319 |
| Tennessee | 6,549,352 | 6,192 |
| Ohio | 11,594,163 | 5,846 |
| Alabama | 4,849,377 | 5,089 |
| South Carolina | 4,832,482 | 4,520 |
| Indiana | 6,596,855 | 4,093 |
| Michigan | 9,909,877 | 3,917 |
| Connecticut | 3,596,677 | 3,862 |
| Kentucky | 4,413,457 | 3,693 |
| New Mexico | 2,085,572 | 3,472 |
| Minnesota | 5,457,173 | 3,391 |
| Idaho | 1,634,464 | 3,302 |
| Kansas | 2,904,021 | 3,228 |
| Louisiana | 4,649,676 | 2,996 |
| Iowa | 3,107,126 | 2,953 |
| Wisconsin | 5,757,564 | 2,858 |
| Nebraska | 1,881,503 | 2,235 |
| Mississippi | 2,994,079 | 1,811 |
| Rhode Island | 1,055,173 | 1,800 |
| District of Columbia | 658,893 | 989 |
| Montana | 1,023,579 | 897 |
| Delaware | 935,614 | 863 |
| New Hampshire | 1,326,813 | 636 |
| Wyoming | 584,153 | 632 |
| South Dakota | 853,175 | 625 |
| West Virginia | 1,850,326 | 553 |
| North Dakota | 739,482 | 545 |
| Maine | 1,330,089 | 469 |
| Vermont | 626,562 | 227 |
Two or More Races Population -As of July 1, 2014
| Geography | Total | Two or More Races |
| United States | 318,857,056 | 7,996,483 |
| California | 38,802,500 | 1,439,722 |
| Texas | 26,956,958 | 491,950 |
| New York | 19,746,227 | 467,091 |
| Florida | 19,893,297 | 395,263 |
| Hawaii | 1,419,561 | 326,361 |
| Washington | 7,061,530 | 315,929 |
| Ohio | 11,594,163 | 241,355 |
| Illinois | 12,880,580 | 235,349 |
| Pennsylvania | 12,787,209 | 233,611 |
| Virginia | 8,326,289 | 233,094 |
| Oklahoma | 3,878,051 | 228,846 |
| Michigan | 9,909,877 | 224,814 |
| North Carolina | 9,943,964 | 205,467 |
| Georgia | 10,097,343 | 197,329 |
| New Jersey | 8,938,175 | 184,190 |
| Arizona | 6,731,484 | 180,201 |
| Maryland | 5,976,407 | 157,658 |
| Colorado | 5,355,866 | 154,367 |
| Massachusetts | 6,745,408 | 148,782 |
| Oregon | 3,970,239 | 143,259 |
| Missouri | 6,063,589 | 127,974 |
| Minnesota | 5,457,173 | 126,787 |
| Indiana | 6,596,855 | 124,801 |
| Tennessee | 6,549,352 | 113,438 |
| Nevada | 2,839,099 | 113,174 |
| Wisconsin | 5,757,564 | 101,679 |
| South Carolina | 4,832,482 | 82,638 |
| Kansas | 2,904,021 | 81,422 |
| Connecticut | 3,596,677 | 79,042 |
| Kentucky | 4,413,457 | 77,399 |
| Alabama | 4,849,377 | 75,078 |
| Louisiana | 4,649,676 | 71,678 |
| Utah | 2,942,902 | 69,397 |
| Arkansas | 2,966,369 | 57,362 |
| Iowa | 3,107,126 | 53,194 |
| Alaska | 736,732 | 52,457 |
| New Mexico | 2,085,572 | 51,142 |
| Nebraska | 1,881,503 | 37,999 |
| Idaho | 1,634,464 | 37,579 |
| Mississippi | 2,994,079 | 35,225 |
| West Virginia | 1,850,326 | 29,094 |
| Rhode Island | 1,055,173 | 27,177 |
| Montana | 1,023,579 | 26,579 |
| Delaware | 935,614 | 23,213 |
| Maine | 1,330,089 | 21,717 |
| New Hampshire | 1,326,813 | 21,186 |
| South Dakota | 853,175 | 18,602 |
| District of Columbia | 658,893 | 17,459 |
| North Dakota | 739,482 | 14,565 |
| Wyoming | 584,153 | 11,451 |
| Vermont | 626,562 | 11,337 |


July 29, 2015
Did you know?, Government/Politics