Historical Flashback: When Oregon became a state – African descent population
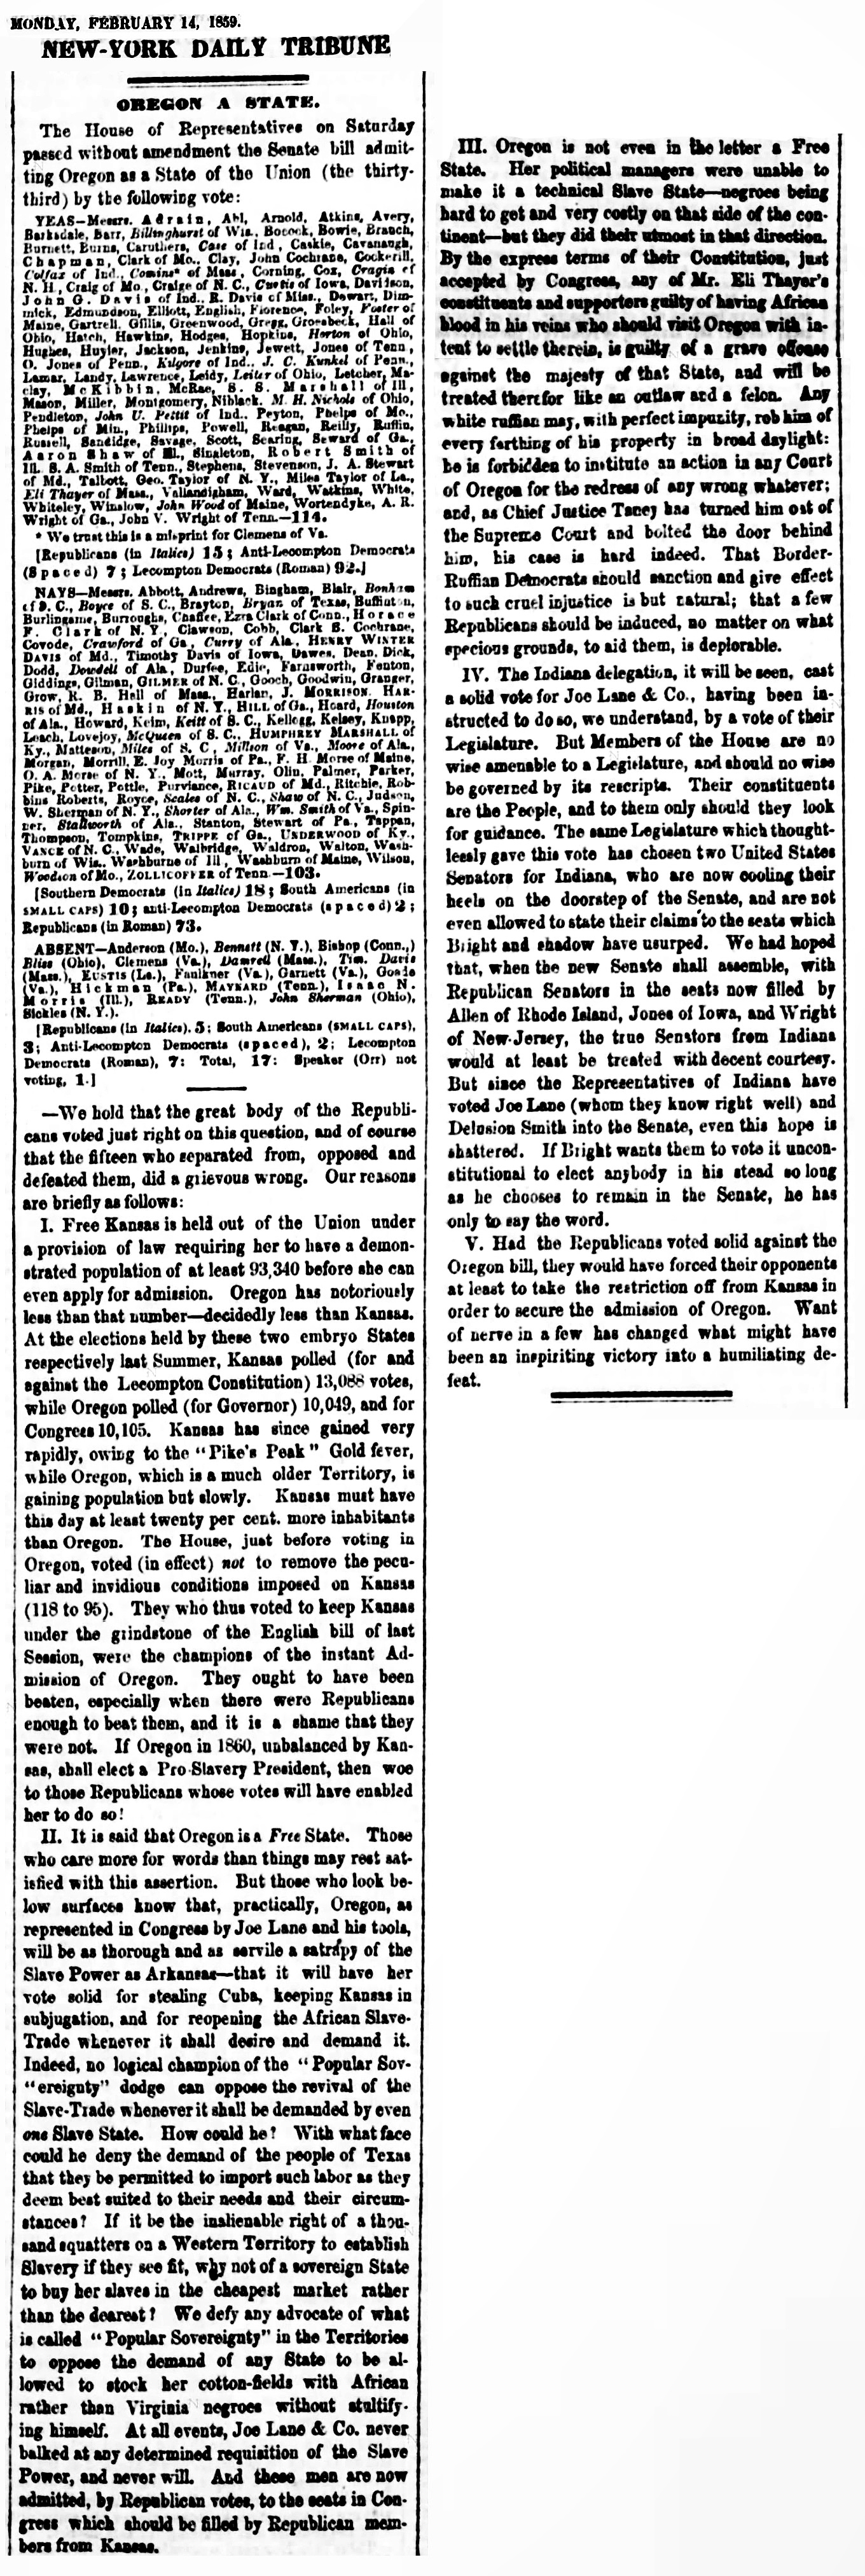
Below are historical newspaper articles on Oregon when it was admitted to the Union, as a state, on February 14, 1859. The newspaper articles speak to the issues of the African descent population.
The Oregon Constitution was framed by a convention of 60 delegates chosen by the people. The convention met on the third Monday in August 1857 and adjourned on September 18 of the same year.
White males over 21 voted the constitution into law on November 9, 1857- approved by the vote of the people of Oregon Territory.
The issues of slavery and admittance of free negroes were voted on separately.
The Congressional debate over slavery delayed action for fourteen months. Finally, a bill was passed by an Act of Congress admitting Oregon, and President James Buchanan signed it on February 14, 1859. Oregon joined the union as a “free” state on the eve of the Civil War. On that date the state Constitution went into effect.
_____
Oregon’s racial makeup
Oregon’s racial makeup has been shaped by 3 black exclusion laws that were in place during much of the region’s early history. These laws, all later rescinded, largely succeeded in their aim of discouraging free blacks from settling in Oregon early on, ensuring that Oregon would develop as primarily white.
White emigrants who came to present-day Oregon during the 1840s and 1850s generally opposed slavery, but many also opposed living alongside African Americans. Many were nonslaveholding farmers from Missouri and other border states who had struggled to compete against those who owned slaves. To avoid a similar competitive situation in Oregon, they favored excluding blacks entirely, although a small number did settle in region. A few immigrants brought slaves to Oregon during this time, taking advantage of the lack of enforcement of Oregon’s anti-slavery laws.
Oregon’s small white population had voted on July 5, 1843, to prohibit slavery by incorporating into Oregon’s 1843 Organic laws a provision of the 1787 Northwest Ordinance: “There shall be neither slavery nor involuntary servitude in the said territory otherwise than in the punishment of crimes whereof the party shall have been duly convicted.” The law was amended, however, on June 26, 1844, by the provisional government’s new legislative council, headed by Missouri immigrant Peter Burnett. As amended, the law prohibited slavery, gave slaveholders a time limit to “remove” their slaves “out of the country,” and freed slaves if their owners refused to remove them.
The effect was to legalize slavery in Oregon for three years. Moreover, once freed, a former slave could not stay in Oregon—a male would have to leave after two years, a female after three. Any free black who refused to leave would be subject to lashing, a provision that was known as “Peter Burnett’s lash law.” Burnett, who later became the first U.S. governor of California, gave this explanation for his support for the law: “The object is to keep clear of that most troublesome class of population [blacks]. We are in a new world, under the most favorable circumstances and we wish to avoid most of those evils that have so much afflicted the United States and other countries.” Because the lashing penalty was judged to be unduly harsh, the council substituted a lesser penalty later that year, and voters rescinded the law in 1845.
The second exclusion law was enacted by the Territorial Legislature on September 21, 1849. This law specified that “it shall not be lawful for any negro or mulatto to enter into, or reside” in Oregon, with exceptions made for those who were already in the territory.
The 1860 census for Oregon, for example, reported 128 African Americans in a total population of 52,465.
Source: State of Oregon
State populations on July 1, 2015
Oregon 4,028,977
State populations on 2014
White 3,317,668 (85.1%)
Two or more races 153,814 (3.9%)
Asian 152,259 (3.9%)
Black or African American 70,700 (1.8%)
American Indian and Alaska Native 47,155 (1.2%)
Native Hawaiian and Other Pacific Islander 14,513 (0.4%)
_______
Hispanic or Latino (of any race)
Mexican 404,999 (10.4%)
Puerto Rican 10,282 (0.3%)
Cuban 4,253 (0.1%)
Other Hispanic or Latino 54,195 (1.4%)
Source: US Census Bureau
____________

Click image of article below to enlarge. Click your return arrow to return to this Dilemma X topic.

________
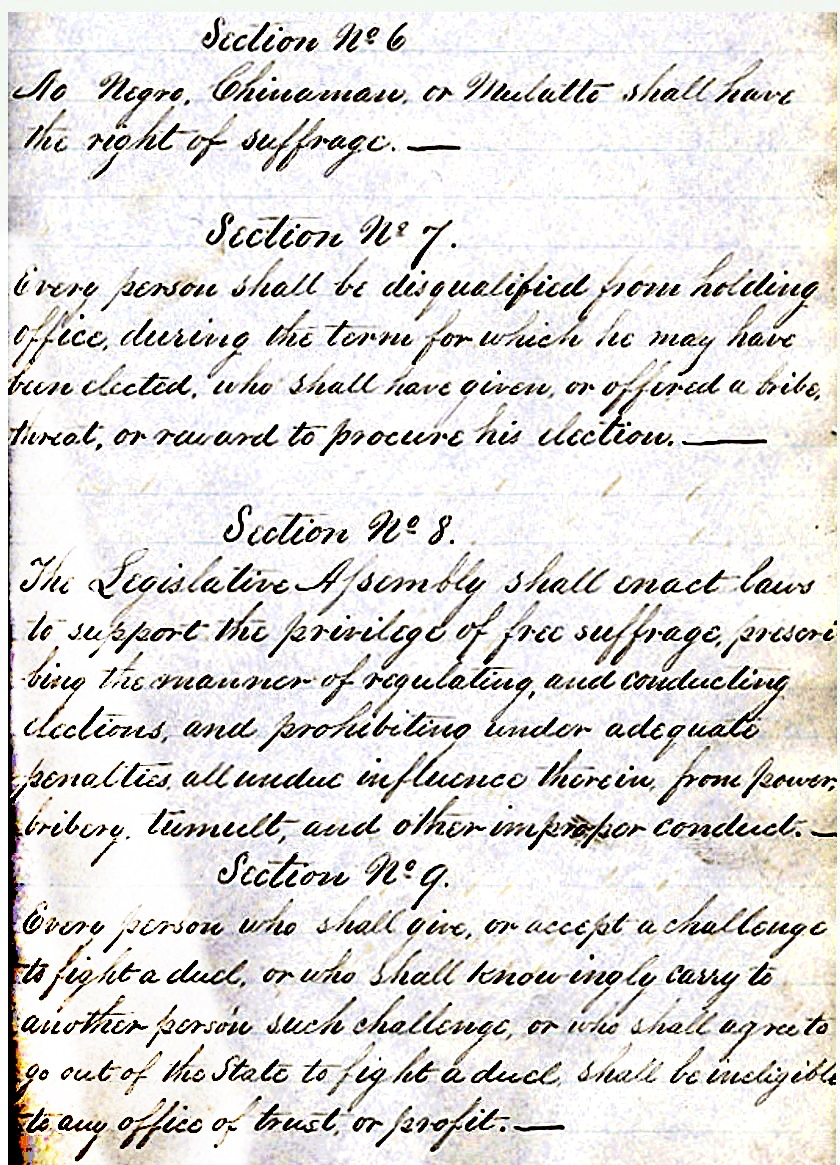
Slavery and the right to vote -Original Oregon Constitution- Amendments
Click image of article below to enlarge. Click your return arrow to return to this Dilemma X topic.
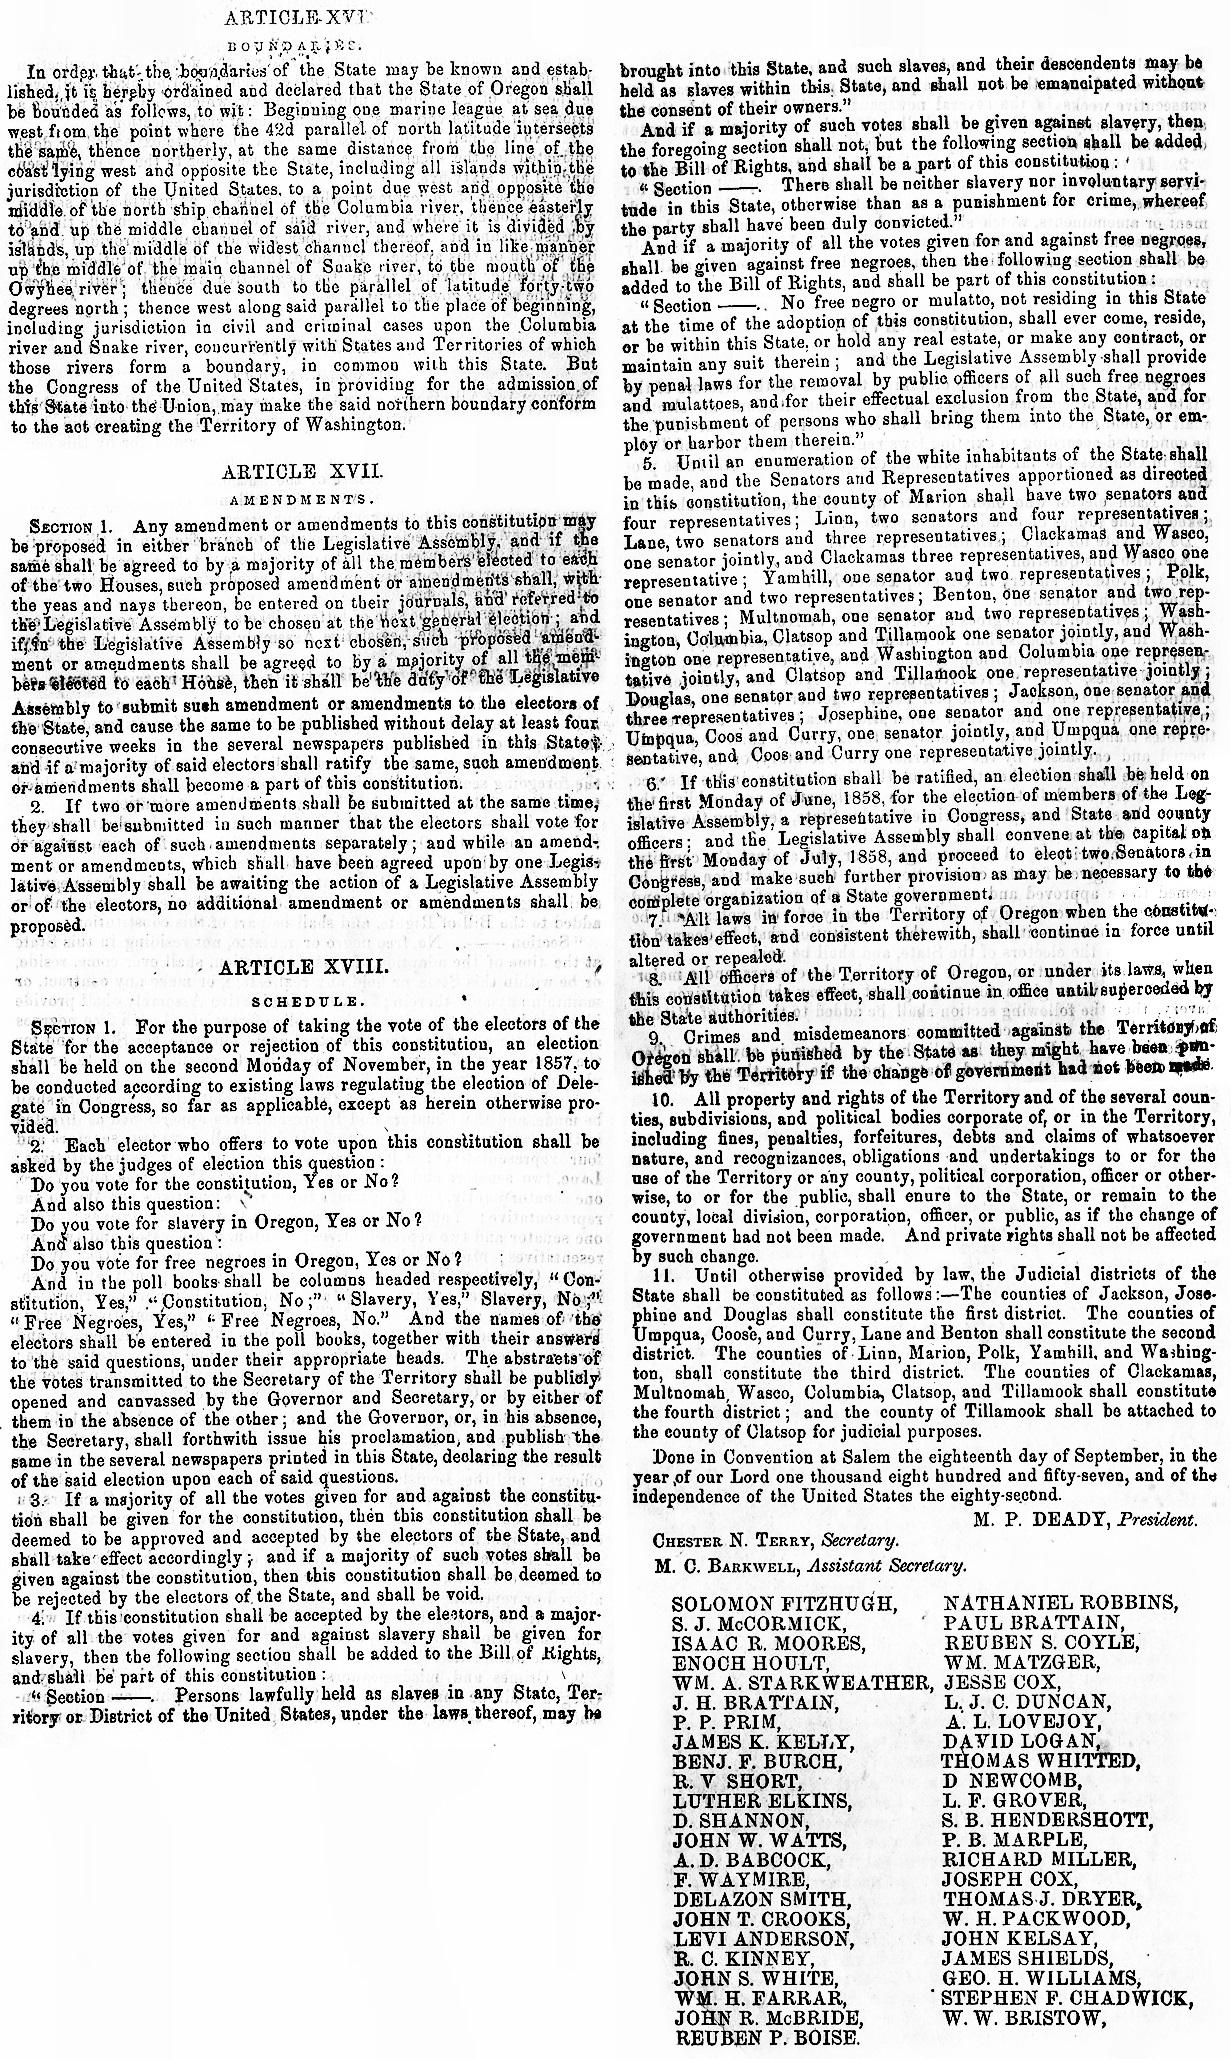
In the original Oregon Constitution, Article II, Sec. 6 provided that “No Negro, Chinaman or Mulatto shall have the right of suffrage.”

Portland, Oregon

2014 population
Portland: 619,360
Portland-Vancouver-Salem OR-WA 3,060,078
_____
Portland
_____
Downtown Portland
_____
Portland TriMet MAX Light Rail
_____


January 4, 2016
Africa, Did you know?, Remember yesteryear