United States elections: A Historical look back on a few mayoral elections
Dilemma X takes this time to reflect back on the elections of a few African Americans to become mayors of American cities.
The African American to be elected mayor of a U.S. town was in 1868, when Pierre Caliste Landry became mayor of Donaldsonville, Louisiana.
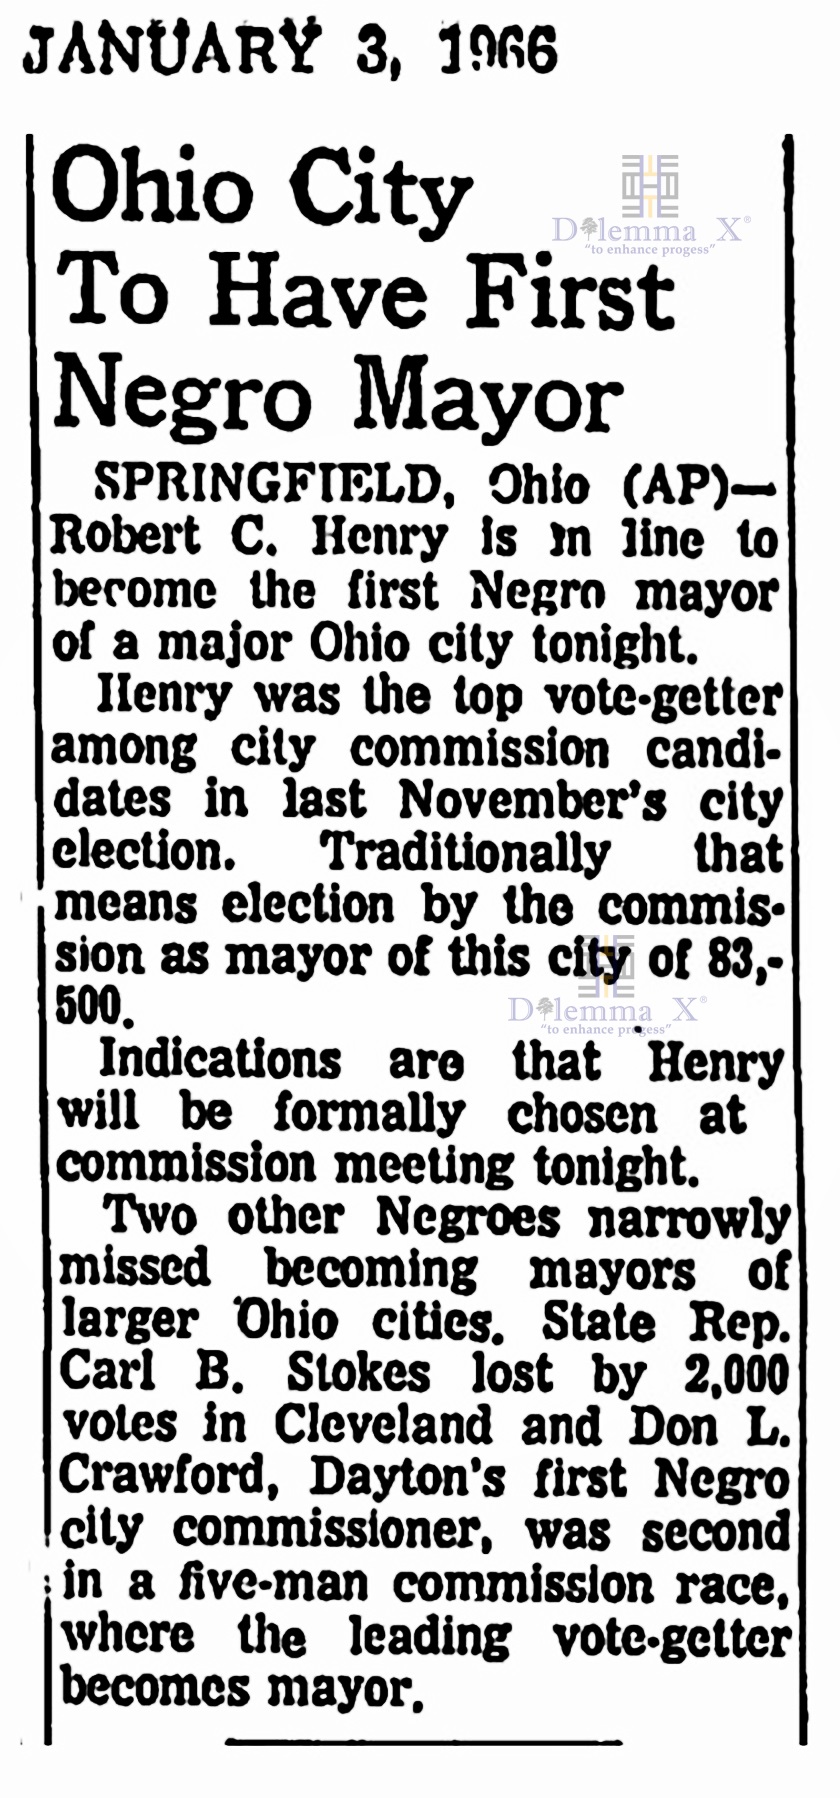
Springfield, OH 1966
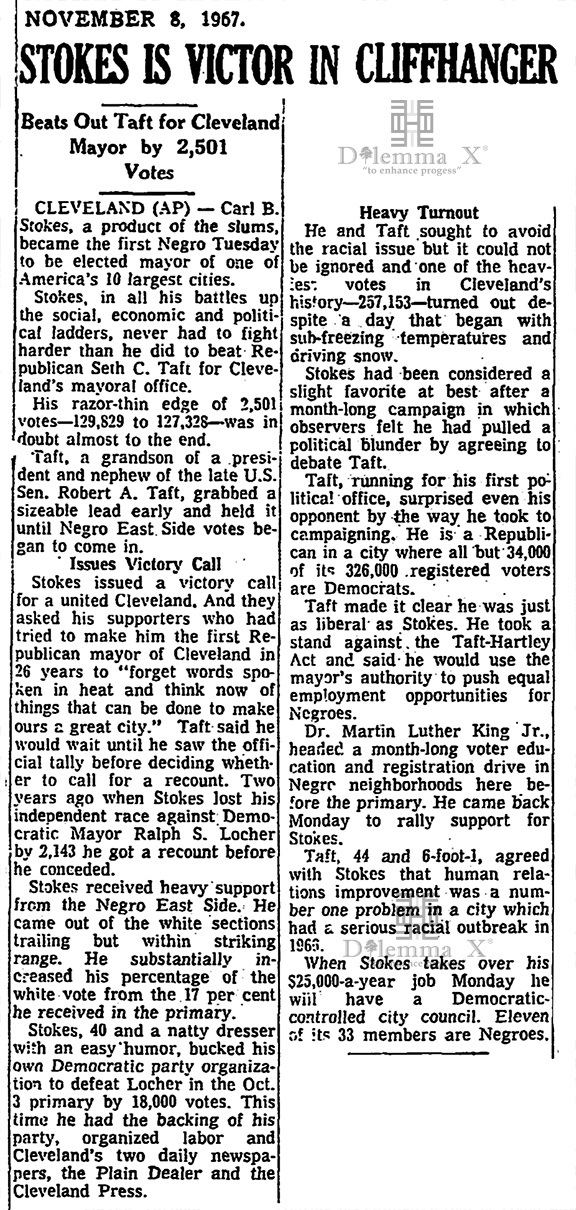
Cleveland, OH 1967

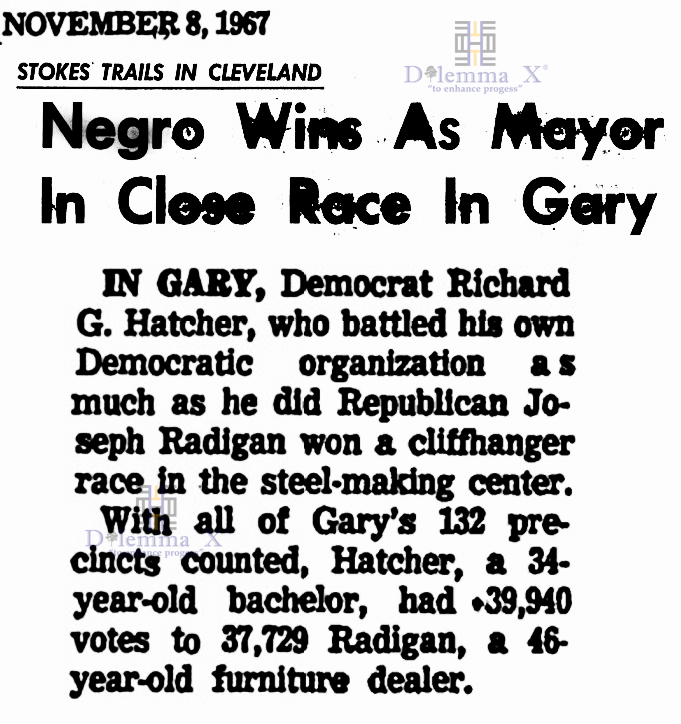
Gary, IN 1967
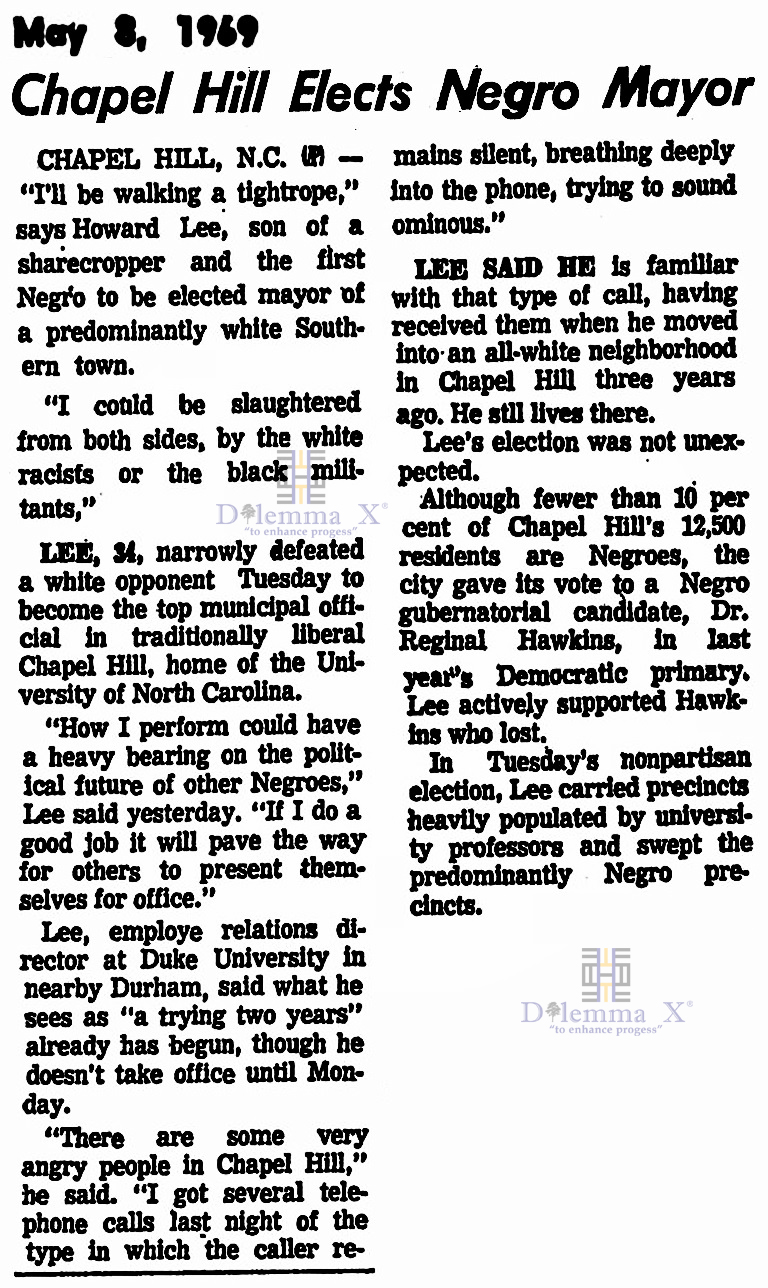
Chapel Hill, NC 1969
Compton, CA 1969

Fayette, MS 1969

Durham, NC 1971
Durham would not elect and African American as mayor until 1989

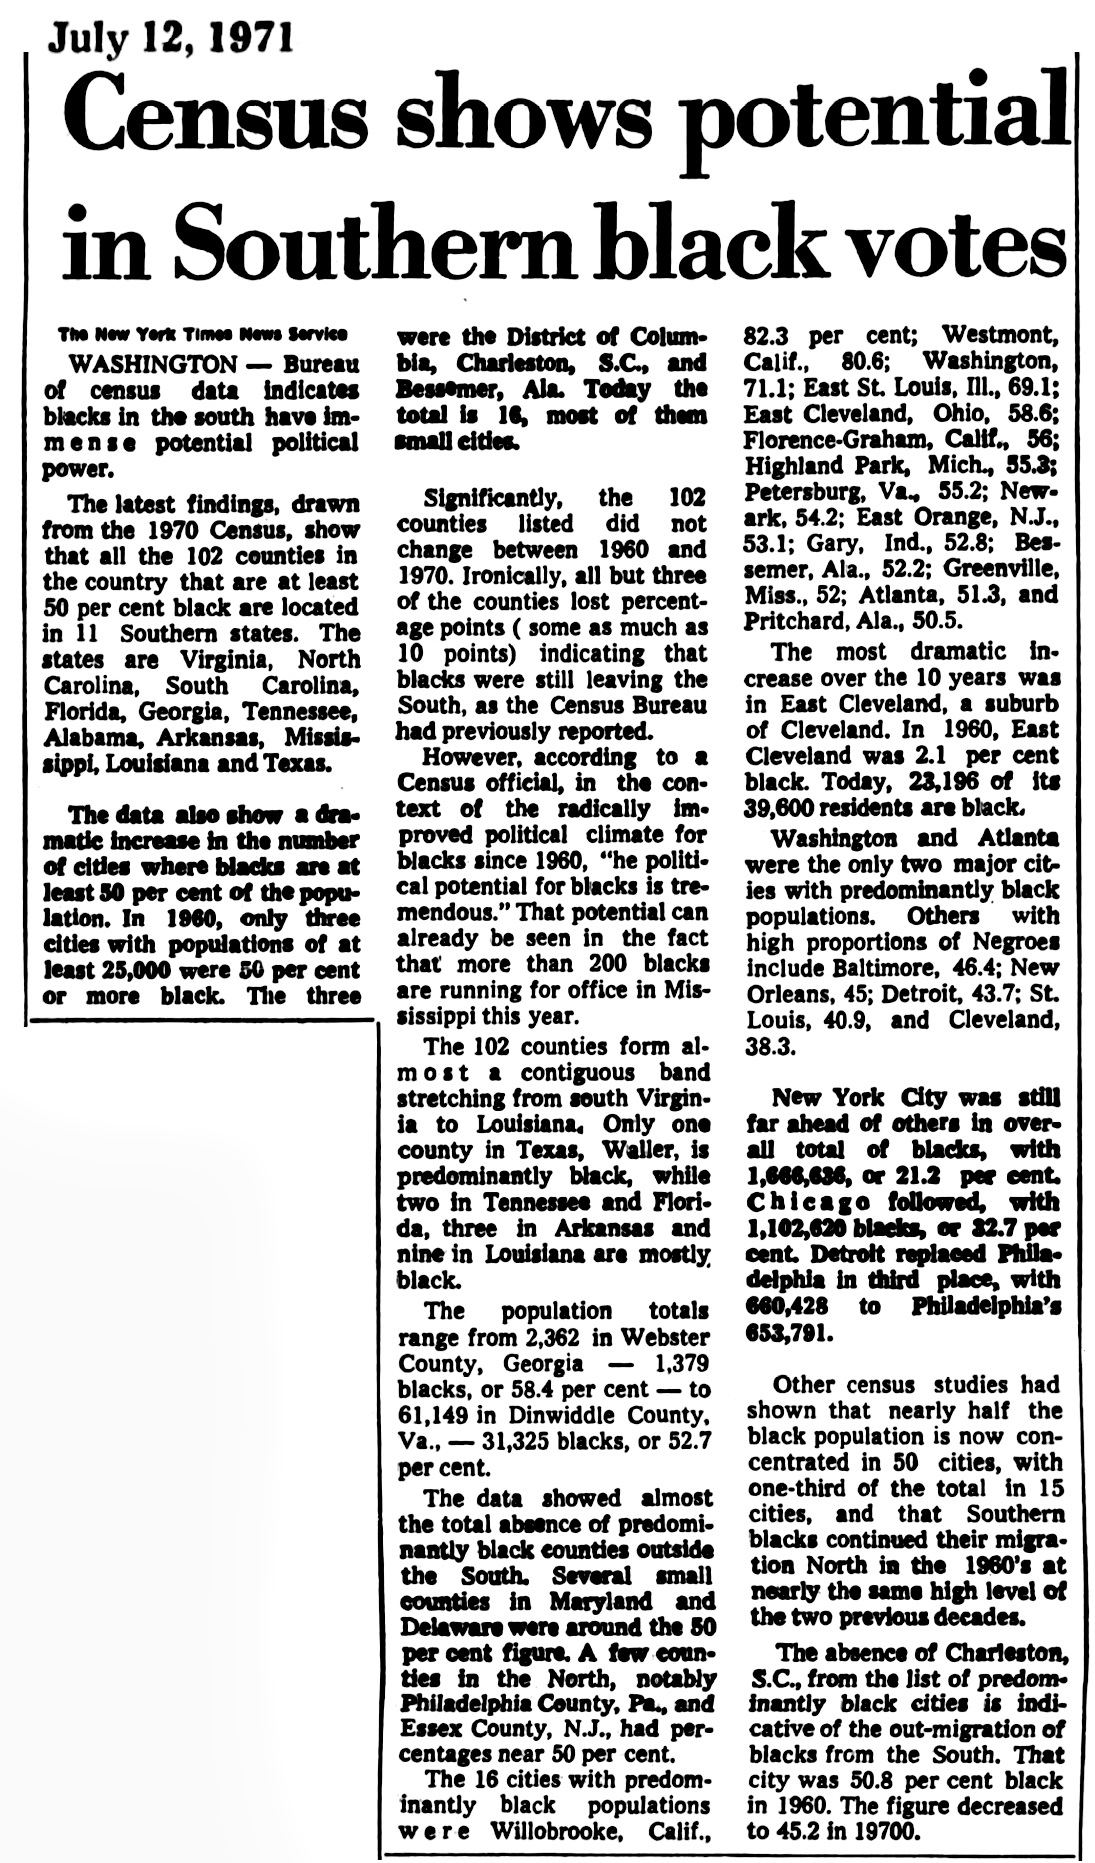
1970 U.S. Census population release 1971

Los Angeles, CA 1973

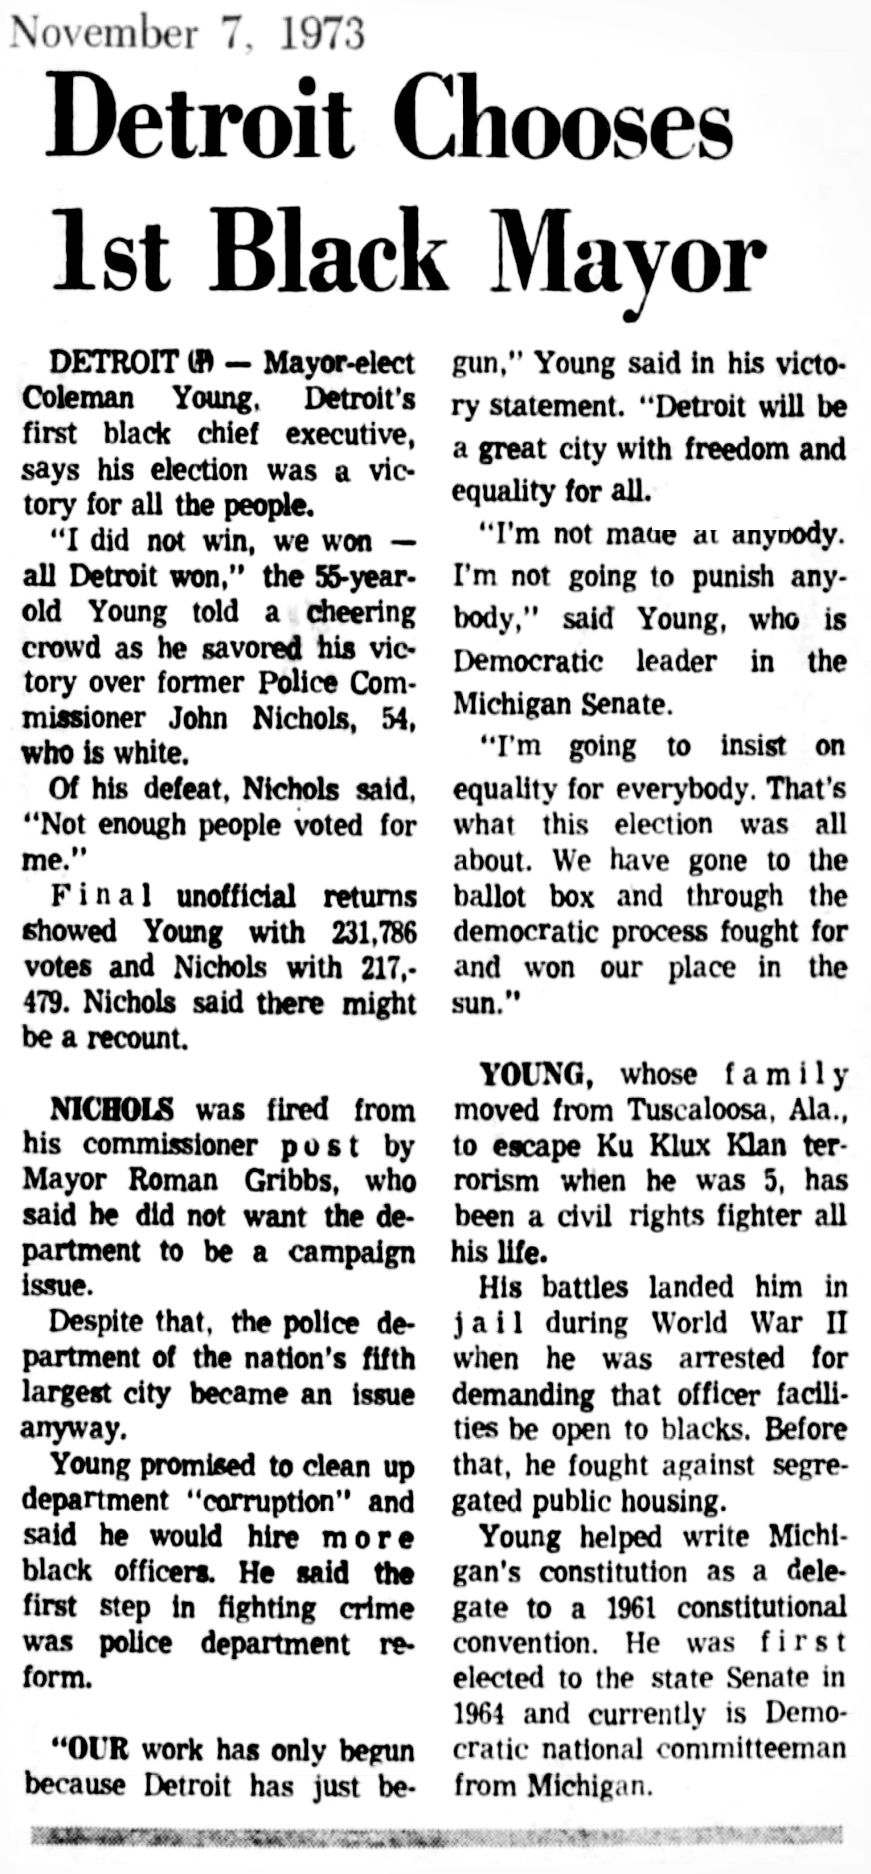
Detroit, MI 1973

Atlanta, GA 1973

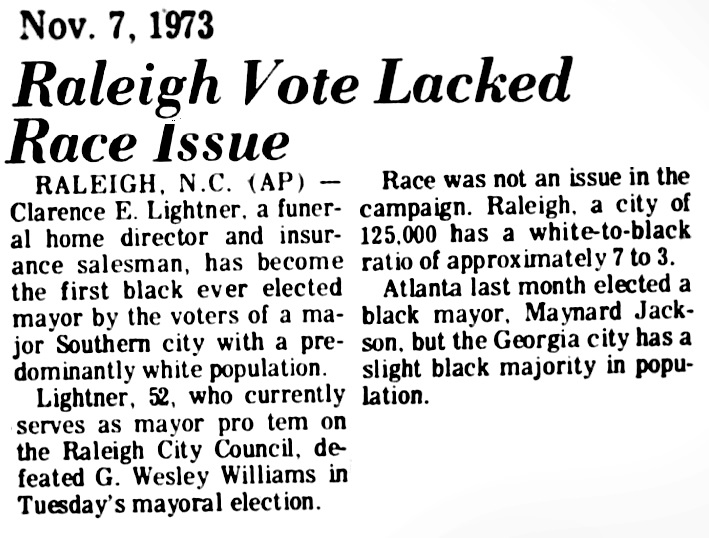
Raleigh, NC 1973


Detroit, MI 1973

New Orleans, LA 1977


Chicago, Il 1983


Philadelphia, PA 1983

Charlotte, NC 1983

Durham, NC 1989

Houston, TX 1997

Fayetteville, NC 2001

Asheville, NC 2005
Greensboro, NC 2007

__________________
List of some of the first African American mayors of larger US cites
All first African American mayors not listed
New York City 1989 David Dinkins
In 2018, New York City is 24.3% Black/African American and 42.8% white
In 1990, New York City is 28.7% Black/African American and 52.3% white
In 1980, New York City is 25.2% Black/African American and 60.7% white
In 1970, New York City is 21.1% Black/African American and 76.6% white
In 1960, New York City is 14.0% Black/African American and 85.3% white
In 1950, New York City is 9.5% Black/African American and 90.2% white
Los Angeles 1973 Tom Bradley
In 2018, Los Angeles is 8.9% Black/African American and 52.2% white
In 1970, Los Angeles is 17.9% Black/African American and 77.2% white
In 1960, Los Angeles is 13.5% Black/African American and 83.2% white
Chicago 1983 Harold Washington
In 2018, Chicago is 30.5% Black/African American and 49.1% white
In 1980, Chicago is 39.8% Black/African American and 49.6% white
In 1970, Chicago is 32.7% Black/African American and 65.6% white
In 1960, Chicago is 22.9% Black/African American and 76.4% white
In 1950, Chicago is 13.6% Black/African American and 85.9% white
Houston 1997 Lee P. Brown
In 2018, Houston is 22.9% Black/African American and 58.5% white
In 2000, Houston is 25.2% Black/African American and 49.2% white
In 1990, Houston is 28.1% Black/African American and 52.7% white
In 1980, Houston is 27.6% Black/African American and 61.3% white
In 1970, Houston is 25.7% Black/African American and 73.4% white
In 1960, Houston is 22.9% Black/African American and 76.8% white
Philadelphia 1983 Wilson Goode
In 2018, Philadelphia is 42.6% Black/African American and 41.6% white
In 1980, Philadelphia is 37.8% Black/African American and 58.2% white
In 1970, Philadelphia is 33.6% Black/African American and 65.6% white
In 1960, Philadelphia is 26.4% Black/African American and 73.3% white
In 1950, Philadelphia is 18.2% Black/African American and 81.7% white
San Antonio 2014 Ivy Taylor
In 2018, San Antonio is 7.0% Black/African American and 80.1% white
In 2010, San Antonio is 6.8% Black/African American and 67.2% white
In 1990, San Antonio is 7.0% Black/African American and 72.2% white
Dallas 1995 Ron Kirk
In 2018, Dallas is 24.3% Black/African American and 61.8% white
In 2000, Dallas is 25.8% Black/African American and 50.8% white
In 1990, Dallas is 29.5% Black/African American and 55.3% white
In 1980, Dallas is 29.4% Black/African American and 61.4% white
In 1970, Dallas is 24.9% Black/African American and 74.2% white
Jacksonville 2011 Alvin Brown
In 2018, Jacksonville is 31.0% Black/African American and 59.2% white
In 2010, Jacksonville is 30.7% Black/African American and 59.4% white
In 1990, Jacksonville is 25.2% Black/African American and 71.9% white
In 1980, Jacksonville is 25.4% Black/African American and 73.0% white
San Francisco 1996 Willie Brown
In 2018, San Francisco is 5.3% Black/African American and 47.2% white
In 2000, San Francisco is 7.7% Black/African American and 49.6% white
In 1990, San Francisco is 10.9% Black/African American and 53.6% white
In 1980, San Francisco is 12.7% Black/African American and 58.2% white
In 1970, San Francisco is 13.4% Black/African American and 71.4% white
Columbus 2000 Michael B. Coleman
In 2018, Columbus is 28.3% Black/African American and 60.5% white
In 2000, Columbus is 24.4% Black/African American and 68.0% white
In 1990, Columbus is 22.6% Black/African American and 74.4% white
Charlotte 1983 Harvey Gantt
In 2018, Charlotte is 35.0% Black/African American and 50.0% white
In 1980, Charlotte is 31.0% Black/African American and 67.4% white
In 1970, Charlotte is 30.3% Black/African American and 69.4% white
Seattle 1989 Norm Rice
In 2018, Seattle is 7.1% Black/African American and 68.6% white
In 1990, Seattle is 10.1% Black/African American and 75.3% white
In 1980, Seattle is 9.5% Black/African American and 79.5% white
In 1970, Seattle is 7.1% Black/African American and 87.4% white
Denver 1991 Wellington Webb
In 2018, Denver is 9.5% Black/African American and 76.9% white
In 1990, Denver is 12.8% Black/African American and 72.1% white
In 1980, Denver is 12.0% Black/African American and 74.8% white
In 1970, Denver is 9.1% Black/African American and 89.0% white
Washington DC 1975 Walter Washington
In 2018, Washington is 47.7% Black/African American and 40.7% white
In 1990, Washington is 65.8% Black/African American and 29.6% white
In 1980, Washington is 70.3% Black/African American and 26.9% white
In 1970, Washington is 71.1% Black/African American and 27.7% white
In 1960, Washington is 53.9% Black/African American and 45.2% white
In 1950, Washington is 35.0% Black/African American and 64.6% white
In 1940, Washington is 28.2% Black/African American and 71.5% white
Detroit 1973 Coleman Young
In 2018, Detroit is 79.1% Black/African American and 14.1% white
In 1990, Detroit is 75.7% Black/African American and 21.6% white
In 1980, Detroit is 63.1% Black/African American and 34.4% white
In 1970, Detroit is 43.7% Black/African American and 55.5% white
In 1960, Detroit is 28.9% Black/African American and 70.8% white
In 1950, Detroit is 16.2% Black/African American and 83.6% white
In 1940, Detroit is 9.2% Black/African American and 90.7% white
Memphis 1982 J.O. Patterson, Jr./1990 W. W. Herenton
In 2018, Memphis is 63.9% Black/African American and 29.2% white
In 1990, Memphis is 54.8% Black/African American and 44.0% white
In 1980, Memphis is 47.6% Black/African American and 51.6% white
In 1970, Memphis is 38.9% Black/African American and 60.8% white
In 1960, Memphis is 37.0% Black/African American and 62.9% white
Baltimore 1987 Clarence H. Burns/1988 Kurt Schmoke
In 2018, Baltimore is 62.8% Black/African American and 31.8% white
In 1990, Baltimore is 59.2% Black/African American and 39.1% white
In 1980, Baltimore is 54.8% Black/African American and 43.9% white
In 1970, Baltimore is 46.4% Black/African American and 53.0% white
In 1960, Baltimore is 34.7% Black/African American and 65% white
In 1950, Baltimore is 23.7% Black/African American and 76.2% white
Milwaukee 2004 Marvin Pratt
In 2018, Milwaukee is 38.9% Black/African American and 45.8% white
In 2000, Milwaukee is 37.3% Black/African American and 50.0% white
In 1990, Milwaukee is 30.5% Black/African American and 63.4% white
In 1980, Milwaukee is 23.1% Black/African American and 73.3% white
In 1970, Milwaukee is 14.7% Black/African American and 84.4% white
In 1960, Milwaukee is 8.4% Black/African American and 91.1% white
In 1950, Milwaukee is 3.4% Black/African American and 96.4% white
Sacramento 2008 Kevin Johnson
In 2018, Sacramento is 13.4% Black/African American and 48.5% white
In 2010, Sacramento is 14.6% Black/African American and 45.0% white
In 1990, Sacramento is 15.3% Black/African American and 60.1% white
Kansas City 1991 Emanuel Cleaver
In 2018, Kansas City is 28.7% Black/African American and 60.3% white
In 1990, Kansas City is 29.6% Black/African American and 66.8% white
In 1980, Kansas City is 27.4% Black/African American and 69.8% white
In 1970, Kansas City is 22.1% Black/African American and 77.2% white
In 1960, Kansas City is 17.5% Black/African American and 82.3% white
In 1950, Kansas City is 12.2% Black/African American and 87.7% white
In 1940, Kansas City is 10.4% Black/African American and 89.5% white
Mobile 2005 Sam Jones
In 2018, Mobile is 50.4% Black/African American and 45.4% white
In 1990 Mobile is 38.9% Black/African American and 59.6% white
In 1980 Mobile is 36.2% Black/African American and 62.8% white
In 1970 Mobile is 35.4% Black/African American and 64.3% white
In 1960 Mobile is 32.4% Black/African American and 67.5% white
Birmingham 1979 Richard Arrington
In 2018, Birmingham is 71.6% Black/African American and 24.6% white
In 1990 Birmingham is 63.3% Black/African American and 36.0% white
In 1980 Birmingham is 55.6% Black/African American and 43.9% white
In 1970 Birmingham is 42.0% Black/African American and 57.8% white
In 1960 Birmingham is 39.6% Black/African American and 60.3% white
Atlanta 1973 Maynard Jackson
In 2018, Atlanta is 52.3% Black/African American and 40.1% white
In 1990, Atlanta is 67.1% Black/African American and 31.0% white
In 1980, Atlanta is 66.6% Black/African American and 32.4% white
In 1970, Atlanta is 51.3% Black/African American and 48.4% white
In 1960, Atlanta is 38.3% Black/African American and 61.7% white
In 1950, Atlanta is 36.6% Black/African American and 63.4% white
In 1940, Atlanta is 34.6% Black/African American and 65.4% white
Raleigh 1973 Clarence Lightner
In 2018, Raleigh is 28.9% Black/African American and 59.0% white
In 1970, Raleigh is 22.7% Black/African American and 76.6% white
Montgomery 2019 Steven Reed
In 2018, Montgomery is 60% Black/African American and 34.1% white
In 1990 Montgomery is 42.3% Black/African American and 56.5% white
In 1980 Montgomery is 39.2% Black/African American and 60.0% white
In 1970 Montgomery is 33.4% Black/African American and 66.4% white
In 1960 Montgomery is 35.1% Black/African American and 64.7% white
Oakland 1978 Lionel Wilson
In 2018, Oakland is 24.3% Black/African American and 36.7% white
In 1980, Oakland is 46.9% Black/African American and 38.2% white
In 1970, Oakland is 34.5% Black/African American and 59.1% white
Minneapolis 1994 Sharon Sayles Belton
In 2018, Minneapolis is 18.9% Black/African American and 63.9% white
In 1990, Minneapolis is 13.0% Black/African American and 78.4% white
In 1980, Minneapolis is 7.7% Black/African American and 87.3% white
In 1970, Minneapolis is 4.4% Black/African American and 93.6% white
In 1960, Minneapolis is 2.4% Black/African American and 96.8% white
New Orleans 1978 Ernest N. Morial
In 2018, New Orleans is 59.8% Black/African American and 34.1% white
In 2010, New Orleans is 60.1% Black/African American and 32.9% white
In 2000, New Orleans is 67.2% Black/African American and 28.0% white
In 1990, New Orleans is 61.9% Black/African American and 34.9% white
In 1980, New Orleans is 55.3% Black/African American and 42.5% white
In 1970, New Orleans is 45.0% Black/African American and 54.5% white
In 1960, New Orleans is 37.2% Black/African American and 62.6% white
In 1950, New Orleans is 31.9% Black/African American and 68.0% white
In 1940, New Orleans is 30.1% Black/African American and 69.7% white
In 1930, New Orleans is 28.3% Black/African American and 71.6% white
Wichita 2007 Carl Brewer
In 2018, Wichita is 11.2% Black/African American and 75.3% white
In 2010, Wichita is 11.4% Black/African American and 71.9% white
In 2000, Wichita is 11.2% Black/African American and 75.5% white
Cleveland 1968 Carl Stokes
In 2018, Cleveland is 50.4% Black/African American and 39.8% white
In 1970, Cleveland is 38.3% Black/African American and 61.0% white
In 1960, Cleveland is 28.6% Black/African American and 71.1% white
In 1950, Cleveland is 16.2% Black/African American and 83.7% white
St. Louis Missouri 1993 Freeman Bosley, Jr.
In 2018, St. Louis is 45.9% Black/African American and 47.6% white
In 1990, St. Louis is 47.5% Black/African American and 50.9% white
In 1980, St. Louis is 45.6% Black/African American and 53.5% white
In 1970, St. Louis is 40.9% Black/African American and 58.7% white
In 1960, St. Louis is 28.6% Black/African American and 71.2% white
In 1950, St. Louis is 17.9% Black/African American and 82.0% white
In 1940, St. Louis is 13.3% Black/African American and 86.6% white
Cincinnati 1972 Ted Berry/ 2005 Mark Mallory
In 2018, Cincinnati is 42.9% Black/African American and 50.4% white
In 1970, Cincinnati is 27.6% Black/African American and 71.9% white
In 1960, Cincinnati is 21.6% Black/African American and 78.2% white
In 1950, Cincinnati is 15.5% Black/African American and 84.4% white
Greensboro 2007 Yvonne Johnson
In 2018, Greensboro is 41.8% Black/African American and 48.0% white
In 2010, Greensboro is 40.6% Black/African American and 48.3% white
In 2000, Greensboro is 36.0% Black/African American and 57.0% white
In 1990, Greensboro is 33.9% Black/African American and 63.9% white
Plano TX 2013 Harry LaRosiliere
In 2018, Plano is 8.3% Black/African American and 67.0% white
In 2010, Plano is 7.5% Black/African American and 66.9% white
In 2000, Plano is 5.0% Black/African American and 78.2% white
Newark 1970 Kenneth A. Gibson
In 2018, Newark is 50.1% Black/African American and 25.3% white
In 1970, Newark is 54.2% Black/African American and 44.0% white
In 1960, Newark is 34.1% Black/African American and 65.6% white
In 1950, Newark is 17.1% Black/African American and 82.8% white
Toledo 2002 Jack Ford
In 2018,Toledo is 27.2% Black/African American and 63.1% white
In 2000, Toledo is 23.5% Black/African American and 70.2% white
In 1990, Toledo is 19.7% Black/African American and 77.0% white
In 1980, Toledo is 17.4% Black/African American and 80.1% white
In 1970, Toledo is 13.8% Black/African American and 85.7% white
In 1960, Toledo is 12.6% Black/African American and 87.3% white
In 1950, Toledo is 8.2% Black/African American and 91.7% white
Durham 1989 Chester Jenkins
In 2018, Durham is 39.7% Black/African American and 48.0% white
In 2010, Durham is 40.9% Black/African American and 42.4% white
In 2000, Durham is 43.4% Black/African American and 45.9% white
In 1990, Durham is 45.7% Black/African American and 51.7% white
In 1980, Durham is 47.1% Black/African American and 51.9% white
In 1970, Durham is 38.8% Black/African American and 60.8% white
Buffalo 2005 Byron Brown
In 2018, Buffalo is 37.1% Black/African American and 47.6% white
In 2010, Buffalo is 38.5% Black/African American and 50.4% white
In 2000, Buffalo is 37.2% Black/African American and 54.4% white
In 1990, Buffalo is 30.7% Black/African American and 64.7% white
In 1980, Buffalo is 26.6% Black/African American and 70.5% white
In 1970, Buffalo is 20.4% Black/African American and 78.7% white
In 1960, Buffalo is 13.2% Black/African American and 86.2% white
In 1950, Buffalo is 6.3% Black/African American and 93.5% white
Norfolk 2016 Kenny Alexander
In 2018, Norfolk is 42.0% Black/African American and 47.4% white
In 2010, Norfolk is 43.1% Black/African American and 47.0% white
In 2000, Norfolk is 44.1% Black/African American and 48.3% white
In 1990, Norfolk is 39.1% Black/African American and 56.7% white
In 1980, Norfolk is 35.2% Black/African American and 60.8% white
In 1970, Norfolk is 28.3% Black/African American and 69.8% white
Chesapeake 1990 William E. Ward
In 2018, Chesapeake is 29.8% Black/African American and 61.8% white
In 1990, Chesapeake is 27.4% Black/African American and 70.7% white
In 1980, Chesapeake is 27.6% Black/African American and 71.1% white
Savannah 1995 Floyd Adams Jr. took office in 1996
In 2018, Savannah is 54.7% Black/African American and 39.1% white
In 1990, Savannah is 51.3% Black/African American and 46.8% white
In 1980, Savannah is 49.0% Black/African American and 49.7% white
In 1970, Savannah is 44.9% Black/African American and 54.6% white
Baton Rouge 2004 Kip Holden
In 2018, Baton Rouge is 54.8% Black/African American and 38.6% white
In 2000, Baton Rouge is 50.0% Black/African American and 45.6% white
In 1990, Baton Rouge is 53.9% Black/African American and 43.9% white
In 1980, Baton Rouge is 36.5% Black/African American and 61.9% white
In 1970, Baton Rouge is 27.8% Black/African American and 71.8% white
Richmond VA 1977 Henry L. Marsh
In 2018, Richmond is 48.2% Black/African American and 44.7% white
In 1980, Richmond is 51.3% Black/African American and 47.8% white
In 1970, Richmond is 42.0% Black/African American and 57.6% white
Spokane 1981 James E. Chase
In 2018, Spokane is 2.3% Black/African American and 85.3% white
In 1980, Spokane is 1.6% Black/African American and 94.3% white
Des Moines 1997 Preston Daniels
In 2018, Des Moines is 11.0% Black/African American and 76.1% white
In 2000, Des Moines is 8.0% Black/African American and 82.31% white
In 1990, Des Moines is 7.1% Black/African American and 89.2% white
Tacoma 1994 Harold Moss
In 2018, Tacoma is 9.9% Black/African American and 66.0% white
In 1990, Tacoma is 11.4% Black/African American and 78.1% white
Fontana CA 2010 Acquanetta Warren
In 2018, Fontana is 8.9% Black/African American and 43.0% white
In 2010, Fontana is 9.9% Black/African American and 47.4% white
Rochester NY 1993 William A. Johnson, Jr.
In 2018, Rochester is 40.7% Black/African American and 46.6% white
In 1990, Rochester is 31.5% Black/African American and 61.1% white
In 1980, Rochester is 25.8% Black/African American and 69.5% white
In 1970, Rochester is 16.8% Black/African American and 82.4% white
In 1960, Rochester is 7.4% Black/African American and 92.4% white
Fayetteville NC 2001 Marshall Pitts Jr.
In 2018, Fayetteville is 41.5% Black/African American and 45.9% white
In 2000, Fayetteville is 39.5% Black/African American and 49.8% white
In 1990, Fayetteville is 38.3% Black/African American and 57.6% white
Little Rock 1981 Charles Bussey
In 2018, Little Rock is 41.6% Black/African American and 50.8% white
In 1980, Little Rock is 32.2% Black/African American and 66.5% white
Columbus GA 1973 A.J. McClung (acting 52 days)
In 2018, Columbus is 45.6% Black/African American and 44.5% white
In 1990, Columbus is 38.1% Black/African American and 58.9% white
In 1970, Columbus is 26.2% Black/African American and 73.3% white
Shreveport 2006 Cedric Glover
In 2018, Shreveport is 56.7% Black/African American and 38.6% white
In 2010, Shreveport is 54.7% Black/African American and 41.1% white
In 2000, Shreveport is 50.8% Black/African American and 46.6% white
In 1990, Shreveport is 54.3% Black/African American and 44.8% white
In 1980, Shreveport is 58.1% Black/African American and 41.1% white
In 1970, Shreveport is 34.1% Black/African American and 65.6% white
Knoxville 2012 Daniel Brown
In 2018, Knoxville is 17.5% Black/African American and 75.2% white
In 2010, Knoxville is 17.0% Black/African American and 76.0% white
In 1990, Knoxville is 15.8% Black/African American and 82.7% white
Columbia SC 2010 Stephen K. Benjamin
In 2018, Columbia is 40.9% Black/African American and 52.3% white
In 2010, Columbia is 42.1% Black/African American and 51.6% white
In 2000, Columbia is 47.0% Black/African American and 48.2% white
Hartford 1981 Thirman Milner
In 2018, Hartford is 37.9% Black/African American and 33.1% white
In 1980, Hartford is % Black/African American and % white
High Point NC 2012 Bernita Sims
In 2018, High Point is 34.0% Black/African American and 51.4% white
In 2010, High Point is 32.9% Black/African American and 53.6% white
In 2000, High Point is 31.5% Black/African American and 60.8% white
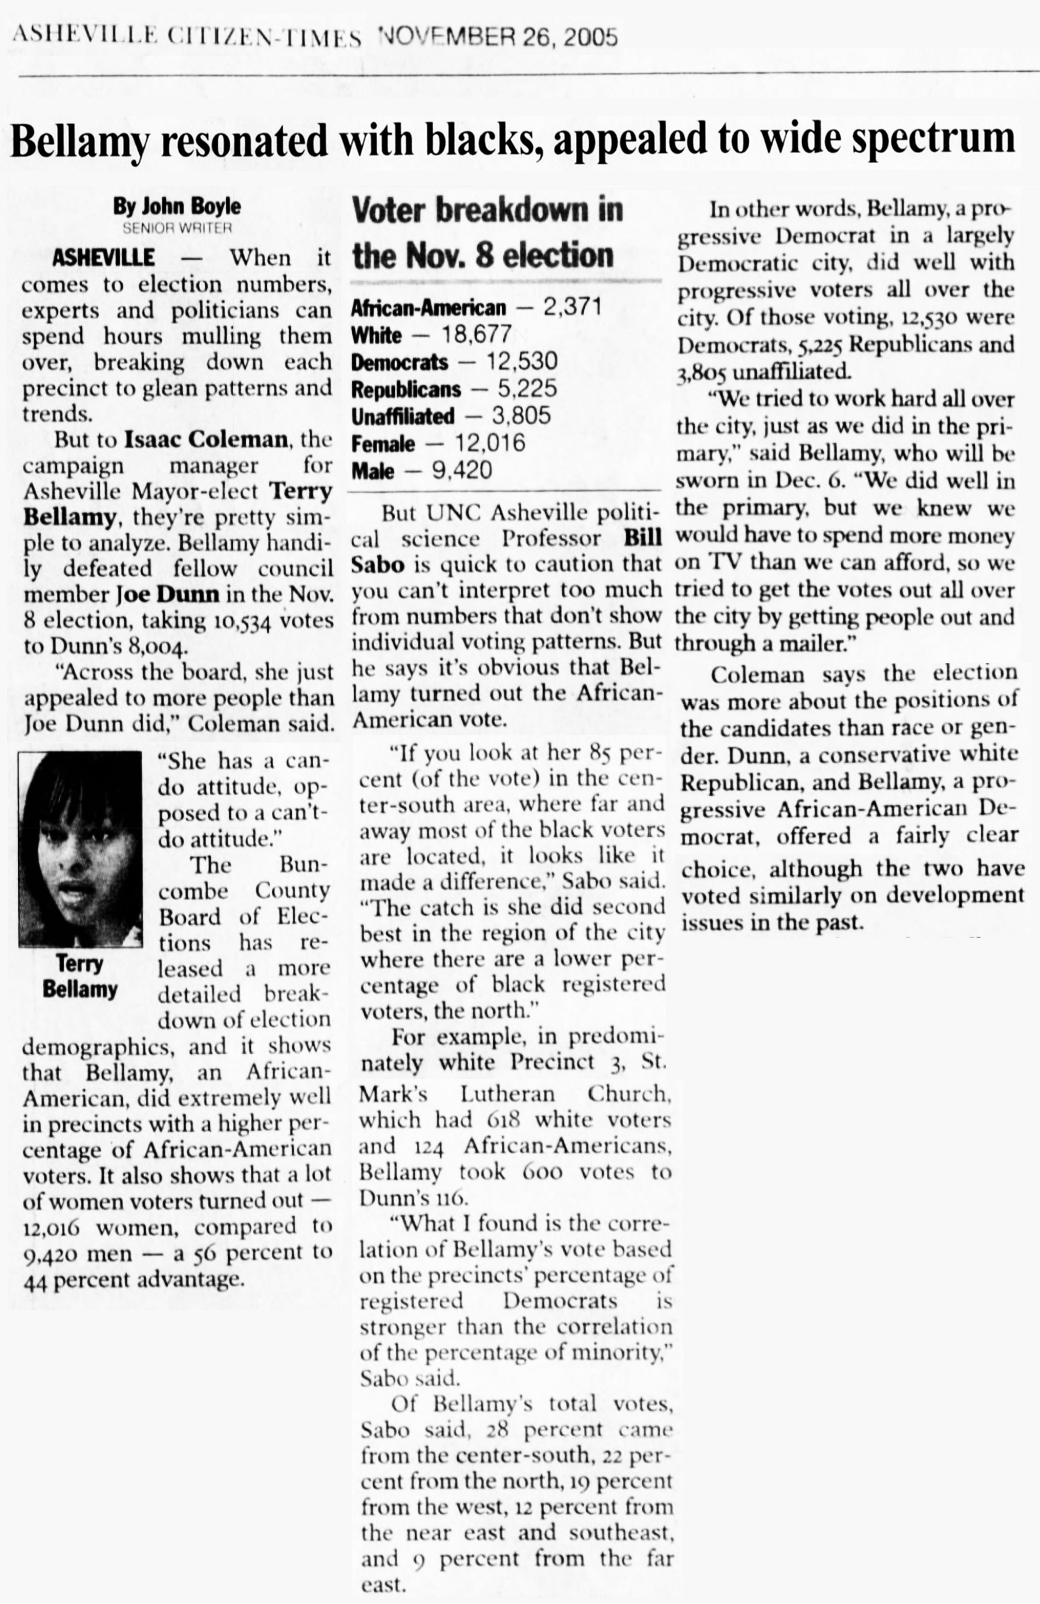
Asheville NC 2005 Terry Bellamy at the age of 33
In 2018, Asheville is 12.0% Black/African American and 82.9% white
In 2010, Asheville is 13.3% Black/African American and 79.3% white
In 2000, Asheville is 17.2% Black/African American and 78.2% white
Waterloo IA 2015 Quentin Hart
In 2018, Waterloo is 15.6% Black/African American and 75.8% white
In 2010, Waterloo is 15.5% Black/African American and 77.2% white
Jackson MS 1997 Harvey Johnson Jr.
In 2018, Jackson is 81.7% Black/African American and 16.9% white
In 2000, Jackson is 70.1% Black/African American and 28.2% white
In 1990, Jackson is 55.7% Black/African American and 43.6% white
In 1980, Jackson is 47.0% Black/African American and 52.4% white
In 1970, Jackson is 39.7% Black/African American and 60.2% white
In 1960, Jackson is 35.7% Black/African American and 64.3% white
Meridian MS 2013 Percy L. Bland
In 2018, Meridian is 60.3% Black/African American and 36.9% white
In 2010, Meridian is 61.5% Black/African American and 35.7% white
In 1990, Jackson is 45.4% Black/African American and 54.0% white
In 1980, Jackson is 37.4% Black/African American and 62.1% white
In 1970, Jackson is 33.5% Black/African American and 66.3% white
Phenix City AL 2012 Eddie Lowe
In 2018, Phenix City is 44.0% Black/African American and 49.3% white
In 2010, Phenix City is 46.5% Black/African American and 48.7% white
In 2000, Phenix City is 44.9% Black/African American and 52.9% white
Selma AL 2000 James Perkins
In 2018, Selma is 80.4% Black/African American and 17.3% white
In 2000, Selma is 69.6% Black/African American and 28.7% white
Philadelphia MS 2009 James Young
In 2018, Philadelphia is 47.3% Black/African American and 47.2% white
In 2010, Philadelphia is 46.8% Black/African American and 47.3% white
In 2000, Philadelphia is 40.0% Black/African American and 55.6% white
Chapel Hill 1969 Howard Nathaniel Lee
Howard Lee was the first African American to be elected as mayor in a majority-white city, and the first to be elected to such a position in the South since Reconstruction.
In 2018, Chapel Hill is 9.7% Black/African American and 72.5% white
In 1980, Chapel Hill is 12.2% Black/African American and 85.4% white
Tuskegee AL 1972 Johnny Ford
In 2018, Tuskegee is 96.6% Black/African American and 1.8% white
Springfield OH 1966 Robert C. Henry
In 2018, Springfield is 17.1% Black/African American and 75% white
Gary IN 1967 Richard G. Hatcher
In 2018, Gary is 81.0% Black/African American and 14.0% white
_____
List of some of the first African American mayors of larger US cites
All first African American mayors not listed
| Rank | City | State | July 1, 2016 Population | 2016 Black Pct | First African American Mayor |
| 1 | New York | New York | 8,537,673 | 24.4% | 1989 David Dinkins |
| 2 | Los Angeles | California | 3,976,322 | 9.0% | 1973 Tom Bradley |
| 3 | Chicago | Illinois | 2,704,958 | 30.9% | 1983 Harold Washington |
| 4 | Houston | Texas | 2,303,482 | 22.8% | 1997 Lee P. Brown |
| 6 | Philadelphia | Pennsylvania | 1,567,872 | 42.9% | 1983 Wilson Goode |
| 7 | San Antonio | Texas | 1,492,510 | 7.1% | 2014 Ivy Taylor |
| 9 | Dallas | Texas | 1,317,929 | 24.6% | 1995 Ron Kirk |
| 12 | Jacksonville | Florida | 880,619 | 30.7% | 2011 Alvin Brown |
| 13 | San Francisco | California | 870,887 | 5.4% | 1996 Willie Brown |
| 14 | Columbus | Ohio | 860,090 | 28.0% | 2000 Michael B. Coleman |
| 17 | Charlotte | North Carolina | 842,051 | 35.3% | 1983 Harvey Gantt |
| 18 | Seattle | Washington | 704,352 | 7.1% | 1989 Norm Rice |
| 19 | Denver | Colorado | 693,060 | 9.8% | 1991 Wellington Webb |
| 21 | Washington | District of Columbia | 681,170 | 48.3% | 1975 Walter Washington |
| 23 | Detroit | Michigan | 672,795 | 79.7% | 1973 Coleman Young |
| 25 | Memphis | Tennessee | 652,717 | 63.6% | 1982 J.O. Patterson, Jr./1990 W. W. Herenton |
| 30 | Baltimore | Maryland | 614,664 | 63.0% | 1987 Clarence H. Burns/1988 Kurt Schmoke |
| 31 | Milwaukee | Wisconsin | 595,047 | 39.2% | 2004 Marvin Pratt |
| 35 | Sacramento | California | 495,234 | 13.7% | 2008 Kevin Johnson |
| 37 | Kansas City | Missouri | 481,420 | 29.1% | 1991 Emanuel Cleaver |
| 38 | Atlanta | Georgia | 472,522 | 52.4% | 1973 Maynard Jackson |
| 41 | Raleigh | North Carolina | 458,880 | 28.9% | 1973 Clarence Lightner |
| 45 | Oakland | California | 420,005 | 24.7% | 1978 Lionel Wilson |
| 46 | Minneapolis | Minnesota | 413,651 | 18.8% | 1994 Sharon Sayles Belton |
| 49 | New Orleans | Louisiana | 391,495 | 59.8% | 1978 Ernest N. Morial |
| 50 | Wichita | Kansas | 389,902 | 11.2% | 2007 Carl Brewer |
| 51 | Cleveland | Ohio | 385,809 | 50.8% | 1968 Carl Stokes |
| 61 | St. Louis | Missouri | 311,404 | 47.9% | 1993 Freeman Bosley, Jr. |
| 65 | Cincinnati | Ohio | 298,800 | 43.1% | 1972 Ted Berry/ 2005 Mark Mallory |
| 68 | Greensboro | North Carolina | 287,027 | 41.8% | 2007 Yvonne Johnson |
| 69 | Plano | Texas | 286,057 | 8.0% | 2013 Harry LaRosiliere |
| 70 | Newark | New Jersey | 281,764 | 50.2% | 1970 Kenneth A. Gibson |
| 72 | Toledo | Ohio | 278,508 | 27.2% | 2002 Jack Ford |
| 78 | Durham | North Carolina | 263,016 | 40.0% | 1989 Chester Jenkins |
| 81 | Buffalo | New York | 256,902 | 37.3% | 2005 Byron Brown |
| 88 | Norfolk | Virginia | 245,115 | 42.2% | 2016 Kenny Alexander |
| 92 | Chesapeake | Virginia | 237,940 | 29.7% | 1990 William E. Ward |
| 97 | Baton Rouge | Louisiana | 227,715 | 55.2% | 2004 Kip Holden |
| 98 | Richmond | Virginia | 223,170 | 48.6% | 1977 Henry L. Marsh |
| 101 | Spokane | Washington | 215,973 | 2.3% | 1981 James E. Chase |
| 102 | Des Moines | Iowa | 215,472 | 11.0% | 1997 Preston Daniels |
| 104 | Birmingham | Alabama | 212,157 | 72.0% | 1979 Richard Arrington, Jr. |
| 105 | Tacoma | Washington | 211,277 | 10.1% | 1994 Harold Moss |
| 106 | Fontana | California | 209,665 | 9.3% | 2010 Acquanetta Warren |
| 107 | Rochester | New York | 208,880 | 40.9% | 1993 William A. Johnson, Jr. |
| 110 | Fayetteville | North Carolina | 204,759 | 42.0% | 2001 Marshall Pitts Jr. |
| 117 | Little Rock | Arkansas | 198,541 | 41.9% | 1981 Charles Bussey |
| 119 | Columbus | Georgia | 197,485 | 45.1% | 1973 A.J. McClung (acting 52 days) |
| 122 | Shreveport | Louisiana | 194,920 | 56.3% | 2006 Cedric Glover |
| 125 | Mobile | Alabama | 192,9047 | 50.6% | 2005 Sam Jones |
| 129 | Knoxville | Tennessee | 186,239 | 17.9% | 2012 Daniel Brown |
| 199 | Columbia | South Carolina | 134,309 | 41.1% | 2010 Stephen K. Benjamin |
| 221 | Hartford | Connecticut | 123,243 | 37.8% | 1981 Thirman Milner |
| 259 | High Point | North Carolina | 111,223 | 32.8% | 2012 Bernita Sims |
| Asheville | North Carolina | 89,121 | 12.3% | 2005 Terry Bellamy at the age of 33 | |
| Gary | IN | 76,424 | 82.9% | 1967 Richard G. Hatcher | |
| Waterloo | Iowa | 67,934 | 15.7% | 2015 Quentin Hart | |
| Springfield | Ohio | 59,087 | 17.4% | 1966 Robert C. Henry | |
| Meridian | Mississippi | 39,113 | 61.1% | 2013 Percy L. Bland | |
| Phenix City | Alabama | 37,132 | 44.3% | 2012 Eddie Lowe | |
| Ithaca | New York | 30,756 | 7.2% | 2012 Svante Myrick | |
| Selma | Alabama | 18,983 | 78.5% | 2000 James Perkins | |
| Brunswick | Georgia | 16,346 | 59.5% | 2014 Cornell Harvey | |
| Tuskegee | Alabama | 8,722 | 95.7% | 1972 Johnny Ford | |
| Philadelphia | Mississippi | 7,361 | 42.9% | 2009 James Young | |
| Camilla | Georgia | 5,170 | 73.1% | 2015 Rufus L Davis II | |
| Fayette | Mississippi | 1,527 | 100.0% | 1969 James Charles Evers |


March 12, 2016
Government/Politics, Remember yesteryear