U.S. Metropolitan areas with the largest African American populations as of 2015

December 8, 2016 release: U.S. Census Bureau
Census Bureau statistics released today are culled from the annual American Community Survey, which provides in-depth state and regional information based on monthly interviews with individuals.
The survey looks at statistics from all 3,142 counties in the U.S. The numbers released today cover the period from 2011 to 2015.
The American Community Survey helps local officials, community leaders and businesses understand the changes taking place in their communities. It is the premier source for detailed information about the American people and workforce.
The American Community Survey (ACS) is an ongoing survey that provides vital information on a yearly basis about our nation and its people. Information from the survey generates data that help determine how more than $400 billion in federal and state funds are distributed each year.
Through the ACS, we know more about jobs and occupations, educational attainment, veterans, whether people own or rent their home, and other topics. Public officials, planners, and entrepreneurs use this information to assess the past and plan the future. When you respond to the ACS, you are doing your part to help your community plan hospitals and schools, support school lunch programs, improve emergency services, build bridges, and inform businesses looking to add jobs and expand to new markets, and more.
______
By Population
| Total Metro Population | Black or African American | |
| New York-Newark, NY-NJ-CT-PA CSA | 23,723,696 | 3,813,973 |
| Washington-Baltimore-Arlington, DC-MD-VA-WV-PA CSA | 9,625,744 | 2,416,074 |
| Atlanta–Athens-Clarke County–Sandy Springs, GA CSA | 6,362,668 | 2,020,222 |
| Chicago-Naperville, IL-IN-WI CSA | 9,923,466 | 1,636,919 |
| Philadelphia-Reading-Camden, PA-NJ-DE-MD CSA | 7,183,479 | 1,396,166 |
| Miami-Fort Lauderdale-Port St. Lucie, FL CSA | 6,654,313 | 1,377,806 |
| Los Angeles-Long Beach, CA CSA | 18,679,763 | 1,231,312 |
| Houston-The Woodlands, TX CSA | 6,857,660 | 1,176,398 |
| Dallas-Fort Worth, TX-OK CSA | 7,503,731 | 1,124,617 |
| Detroit-Warren-Ann Arbor, MI CSA | 5,319,913 | 1,096,353 |
| Memphis-Forrest City, TN-MS-AR CSA | 1,370,161 | 641,036 |
| Charlotte-Concord, NC-SC CSA | 2,583,956 | 571,923 |
| Virginia Beach-Norfolk, VA-NC CSA | 1,827,009 | 549,774 |
| Cleveland-Akron-Canton, OH CSA | 3,493,596 | 536,873 |
| Boston-Worcester-Providence, MA-RI-NH-CT CSA | 8,152,573 | 531,732 |
| San Jose-San Francisco-Oakland, CA CSA | 8,713,914 | 522,023 |
| St. Louis-St. Charles-Farmington, MO-IL CSA | 2,917,172 | 516,710 |
| New Orleans-Metairie-Hammond, LA-MS CSA | 1,493,205 | 499,625 |
| Raleigh-Durham-Chapel Hill, NC CSA | 2,117,103 | 488,725 |
| Orlando-Deltona-Daytona Beach, FL CSA | 3,129,308 | 458,892 |
| Richmond, VA Metro Area | 1,246,215 | 373,687 |
| Birmingham-Hoover-Talladega, AL CSA | 1,319,422 | 364,208 |
| Greensboro–Winston-Salem–High Point, NC CSA | 1,642,506 | 349,665 |
| Tampa-St. Petersburg-Clearwater, FL Metro Area | 2,888,458 | 346,574 |
| Columbia-Orangeburg-Newberry, SC CSA | 937,794 | 338,375 |
| Jacksonville-St. Marys-Palatka, FL-GA CSA | 1,573,606 | 335,762 |
| Jackson-Vicksburg-Brookhaven, MS CSA | 670,319 | 326,650 |
| Columbus-Marion-Zanesville, OH CSA | 2,424,831 | 316,623 |
| Indianapolis-Carmel-Muncie, IN CSA | 2,371,865 | 306,969 |
| San Juan-Carolina, PR CSA | 2,495,780 | 296,411 |
| Minneapolis-St. Paul, MN-WI CSA | 3,866,768 | 291,493 |
| Milwaukee-Racine-Waukesha, WI CSA | 2,046,692 | 286,014 |
| Nashville-Davidson–Murfreesboro, TN CSA | 1,951,597 | 283,660 |
| Kansas City-Overland Park-Kansas City, MO-KS CSA | 2,427,532 | 278,247 |
| Cincinnati-Wilmington-Maysville, OH-KY-IN CSA | 2,217,828 | 263,083 |
| Greenville-Spartanburg-Anderson, SC CSA | 1,426,066 | 261,696 |
| Las Vegas-Henderson, NV-AZ CSA | 2,362,015 | 235,481 |
| Seattle-Tacoma, WA CSA | 4,602,591 | 232,852 |
| Phoenix-Mesa-Scottsdale, AZ Metro Area | 4,407,915 | 227,743 |
| Little Rock-North Little Rock, AR CSA | 903,900 | 220,611 |
| Pittsburgh-New Castle-Weirton, PA-OH-WV CSA | 2,649,496 | 198,858 |
| Louisville/Jefferson County–Elizabethtown–Madison, KY-IN CSA | 1,504,754 | 195,973 |
| Fayetteville-Lumberton-Laurinburg, NC CSA | 546,215 | 181,386 |
| Savannah-Hinesville-Statesboro, GA CSA | 530,661 | 177,149 |
| Columbus-Auburn-Opelika, GA-AL CSA | 504,052 | 176,115 |
| Lafayette-Opelousas-Morgan City, LA CSA | 627,146 | 170,718 |
| Mobile-Daphne-Fairhope, AL CSA | 619,104 | 168,205 |
| Montgomery, AL Metro | 375,435 | 166,413 |
| Sacramento-Roseville, CA CSA | 2,544,026 | 166,145 |
| San Diego-Carlsbad, CA Metro Area | 3,223,096 | 163,276 |
| Denver-Aurora, CO CSA | 3,418,876 | 161,462 |
| Macon-Warner Robins, GA CSA | 419,401 | 161,147 |
| Hartford-West Hartford, CT CSA | 1,483,187 | 152,393 |
| San Antonio-New Braunfels, TX Metro Area | 2,286,702 | 151,999 |
| Buffalo-Cheektowaga, NY CSA | 1,213,152 | 142,612 |
| Rocky Mount-Wilson-Roanoke Rapids, NC CSA | 302,665 | 141,022 |
| Tallahassee-Bainbridge, FL-GA CSA | 405,612 | 138,885 |
| Oklahoma City-Shawnee, OK CSA | 1,430,327 | 138,779 |
| Austin-Round Rock, TX Metro Area | 1,889,094 | 138,633 |
| Dayton-Springfield-Sidney, OH CSA | 1,076,832 | 134,184 |
| Rochester-Batavia-Seneca Falls, NY CSA | 1,175,724 | 131,124 |
| Huntsville-Decatur-Albertville, AL CSA | 692,157 | 119,395 |
| Monroe-Ruston-Bastrop, LA CSA | 253,407 | 97,592 |
| Grand Rapids-Wyoming-Muskegon, MI CSA | 1,433,288 | 95,762 |
| Harrisburg-York-Lebanon, PA CSA | 1,247,235 | 89,334 |
| Tulsa-Muskogee-Bartlesville, OK CSA | 1,150,961 | 89,219 |
| Chattanooga-Cleveland-Dalton, TN-GA-AL CSA | 949,394 | 86,971 |
| Cape Coral-Fort Myers-Naples, FL CSA | 1,059,287 | 86,482 |
| Toledo-Port Clinton, OH CSA | 646,833 | 85,600 |
| Greenville-Washington, NC CSA | 223,493 | 75,304 |
| Portland-Vancouver-Salem, OR-WA CSA | 3,111,922 | 73,876 |
| Myrtle Beach-Conway, SC-NC CSA | 493,262 | 73,728 |
| Albany-Schenectady, NY CSA | 1,173,891 | 73,532 |
| Omaha-Council Bluffs-Fremont, NE-IA CSA | 952,263 | 71,834 |
| South Bend-Elkhart-Mishawaka, IN-MI CSA | 725,065 | 70,792 |
| North Port-Sarasota, FL CSA | 977,491 | 68,181 |
| Lexington-Fayette–Richmond–Frankfort, KY CSA | 719,949 | 65,661 |
| Gainesville-Lake City, FL CSA | 345,229 | 65,239 |
| Youngstown-Warren, OH-PA CSA | 654,691 | 62,989 |
| Syracuse-Auburn, NY CSA | 738,746 | 58,319 |
| Knoxville-Morristown-Sevierville, TN CSA | 1,109,429 | 55,515 |
| Dothan-Enterprise-Ozark, AL CSA | 248,947 | 54,907 |
| Longview-Marshall, TX CSA | 284,527 | 54,714 |
| Wichita-Arkansas City-Winfield, KS CSA | 680,290 | 53,990 |
| Fresno-Madera, CA CSA | 1,129,859 | 51,643 |
| Kalamazoo-Battle Creek-Portage, MI CSA | 530,672 | 46,814 |
| Springfield-Greenfield Town, MA CSA | 702,583 | 46,504 |
| Tyler-Jacksonville, TX CSA | 274,478 | 45,970 |
| Rockford-Freeport-Rochelle, IL CSA | 438,071 | 42,850 |
| Fort Wayne-Huntington-Auburn, IN CSA | 626,124 | 42,127 |
| Lansing-East Lansing-Owosso, MI CSA | 540,895 | 39,841 |
| Saginaw-Midland-Bay City, MI CSA | 382,598 | 37,452 |
| Tucson-Nogales, AZ CSA | 1,056,486 | 36,801 |
| Peoria-Canton, IL CSA | 412,686 | 36,764 |
| El Paso-Las Cruces, TX-NM CSA | 1,052,314 | 35,319 |
| Madison-Janesville-Beloit, WI CSA | 866,475 | 34,589 |
| Des Moines-Ames-West Des Moines, IA CSA | 782,390 | 32,970 |
| New Bern-Morehead City, NC CSA | 193,945 | 32,244 |
| Salt Lake City-Provo-Orem, UT CSA | 2,468,347 | 31,150 |
| Ponce-Coamo-Santa Isabel, PR CSA | 399,540 | 30,660 |
| Davenport-Moline, IA-IL CSA | 475,363 | 29,511 |
| Albuquerque-Santa Fe-Las Vegas, NM CSA | 1,168,795 | 28,845 |
| Springfield-Jacksonville-Lincoln, IL CSA | 314,958 | 28,555 |
| Charleston-Huntington-Ashland, WV-OH-KY CSA | 692,348 | 26,952 |
| Hickory-Lenoir, NC CSA | 407,499 | 24,856 |
| Modesto-Merced, CA CSA | 806,843 | 23,644 |
| Asheville-Brevard, NC CSA | 480,051 | 23,318 |
| Erie-Meadville, PA CSA | 364,529 | 22,078 |
| Lubbock-Levelland, TX CSA | 335,866 | 20,528 |
| Columbia-Moberly-Mexico, MO CSA | 226,174 | 19,302 |
| Cedar Rapids-Iowa City, IA CSA | 432,538 | 19,128 |
| Rome-Summerville, GA CSA | 122,370 | 17,659 |
| Corpus Christi-Kingsville-Alice, TX CSA | 522,751 | 17,320 |
| Bloomington-Pontiac, IL CSA | 225,396 | 16,044 |
| Visalia-Porterville-Hanford, CA CSA | 610,828 | 15,911 |
| Jonesboro-Paragould, AR CSA | 172,590 | 15,792 |
| Midland-Odessa, TX CSA | 324,863 | 15,577 |
| Lima-Van Wert-Celina, OH CSA | 219,831 | 14,631 |
| Amarillo-Borger, TX CSA | 283,924 | 14,015 |
| Bowling Green-Glasgow, KY CSA | 219,168 | 13,862 |
| Cape Girardeau-Sikeston, MO-IL CSA | 135,550 | 13,436 |
| Harrisonburg-Staunton-Waynesboro, VA CSA | 251,352 | 13,048 |
| DeRidder-Fort Polk South, LA CSA | 87,265 | 12,763 |
| Lincoln-Beatrice, NE CSA | 345,457 | 12,740 |
| Johnson City-Kingsport-Bristol, TN-VA CSA | 506,193 | 12,614 |
| Paducah-Mayfield, KY-IL CSA | 136,018 | 12,221 |
| Springfield-Branson, MO CSA | 540,609 | 12,156 |
| Hot Springs-Malvern, AR CSA | 130,603 | 11,943 |
| Reno-Carson City-Fernley, NV CSA | 605,954 | 11,309 |
| Manhattan-Junction City, KS CSA | 135,575 | 10,595 |
| Portland-Lewiston-South Portland, ME CSA | 633,528 | 10,296 |
| Lafayette-West Lafayette-Frankfort, IN CSA | 247,606 | 9,500 |
| Rochester-Austin, MN CSA | 252,989 | 9,150 |
| State College-DuBois, PA CSA | 241,574 | 8,919 |
| Fargo-Wahpeton, ND-MN CSA | 256,616 | 8,819 |
| Mansfield-Ashland-Bucyrus, OH CSA | 217,226 | 8,498 |
| Bloomsburg-Berwick-Sunbury, PA CSA | 263,873 | 8,482 |
| Elmira-Corning, NY CSA | 184,702 | 8,362 |
| Spokane-Spokane Valley-Coeur d’Alene, WA-ID CSA | 697,153 | 8,248 |
| Victoria-Port Lavaca, TX CSA | 120,935 | 7,705 |
| Morgantown-Fairmont, WV CSA | 195,101 | 7,232 |
| Kokomo-Peru, IN CSA | 118,418 | 7,170 |
| Martin-Union City, TN-KY CSA | 70,211 | 7,170 |
| Boise City-Mountain Home-Ontario, ID-OR CSA | 756,244 | 7,146 |
| Appleton-Oshkosh-Neenah, WI CSA | 402,553 | 6,598 |
| Williamsport-Lock Haven, PA CSA | 155,489 | 6,443 |
| Johnstown-Somerset, PA CSA | 211,933 | 6,368 |
| Pueblo-Cañon City, CO CSA | 210,283 | 5,959 |
| Green Bay-Shawano, WI CSA | 362,457 | 5,767 |
| McAllen-Edinburg, TX CSA | 906,099 | 5,761 |
| Mayagüez-San Germán, PR CSA | 227,075 | 5,646 |
| Mount Pleasant-Alma, MI CSA | 112,238 | 4,507 |
| Bloomington-Bedford, IN CSA | 211,072 | 4,403 |
| Quincy-Hannibal, IL-MO CSA | 116,319 | 3,985 |
| Clovis-Portales, NM CSA | 69,518 | 3,952 |
| Sioux City-Vermillion, IA-SD-NE CSA | 178,572 | 3,937 |
| Dixon-Sterling, IL CSA | 91,663 | 3,617 |
| Ithaca-Cortland, NY CSA | 153,420 | 3,484 |
| Mankato-New Ulm-North Mankato, MN CSA | 124,447 | 3,380 |
| Findlay-Tiffin, OH CSA | 131,183 | 3,269 |
| Richmond-Connersville, IN CSA | 91,100 | 3,211 |
| Redding-Red Bluff, CA CSA | 242,841 | 2,940 |
| Joplin-Miami, MO-OK CSA | 209,192 | 2,146 |
| Wausau-Stevens Point-Wisconsin Rapids, WI CSA | 307,691 | 2,078 |
| Eau Claire-Menomonie, WI CSA | 210,133 | 1,886 |
| Medford-Grants Pass, OR CSA | 297,312 | 1,884 |
| Brownsville-Harlingen-Raymondville, TX CSA | 444,308 | 1,862 |
| Parkersburg-Marietta-Vienna, WV-OH CSA | 153,888 | 1,836 |
| Pullman-Moscow, WA-ID CSA | 86,955 | 1,328 |
| Rapid City-Spearfish, SD CSA | 170,176 | 1,211 |
| Bend-Redmond-Prineville, OR CSA | 198,233 | 1,128 |
| Edwards-Glenwood Springs, CO CSA | 131,661 | 723 |
| Moses Lake-Othello, WA CSA | 112,514 | 539 |
| Idaho Falls-Rexburg-Blackfoot, ID CSA | 236,486 | 219 |
______
By Name
| Metro Pop. | Black or African American | |
| Albany-Schenectady, NY CSA | 1,173,891 | 73,532 |
| Albuquerque-Santa Fe-Las Vegas, NM CSA | 1,168,795 | 28,845 |
| Amarillo-Borger, TX CSA | 283,924 | 14,015 |
| Appleton-Oshkosh-Neenah, WI CSA | 402,553 | 6,598 |
| Asheville-Brevard, NC CSA | 480,051 | 23,318 |
| Atlanta–Athens-Clarke County–Sandy Springs, GA CSA | 6,362,668 | 2,020,222 |
| Austin-Round Rock, TX Metro Area | 1,889,094 | 138,633 |
| Bend-Redmond-Prineville, OR CSA | 198,233 | 1,128 |
| Birmingham-Hoover-Talladega, AL CSA | 1,319,422 | 364,208 |
| Bloomington-Bedford, IN CSA | 211,072 | 4,403 |
| Bloomington-Pontiac, IL CSA | 225,396 | 16,044 |
| Bloomsburg-Berwick-Sunbury, PA CSA | 263,873 | 8,482 |
| Boise City-Mountain Home-Ontario, ID-OR CSA | 756,244 | 7,146 |
| Boston-Worcester-Providence, MA-RI-NH-CT CSA | 8,152,573 | 531,732 |
| Bowling Green-Glasgow, KY CSA | 219,168 | 13,862 |
| Brownsville-Harlingen-Raymondville, TX CSA | 444,308 | 1,862 |
| Buffalo-Cheektowaga, NY CSA | 1,213,152 | 142,612 |
| Cape Coral-Fort Myers-Naples, FL CSA | 1,059,287 | 86,482 |
| Cape Girardeau-Sikeston, MO-IL CSA | 135,550 | 13,436 |
| Cedar Rapids-Iowa City, IA CSA | 432,538 | 19,128 |
| Charleston-Huntington-Ashland, WV-OH-KY CSA | 692,348 | 26,952 |
| Charlotte-Concord, NC-SC CSA | 2,583,956 | 571,923 |
| Chattanooga-Cleveland-Dalton, TN-GA-AL CSA | 949,394 | 86,971 |
| Chicago-Naperville, IL-IN-WI CSA | 9,923,466 | 1,636,919 |
| Cincinnati-Wilmington-Maysville, OH-KY-IN CSA | 2,217,828 | 263,083 |
| Cleveland-Akron-Canton, OH CSA | 3,493,596 | 536,873 |
| Clovis-Portales, NM CSA | 69,518 | 3,952 |
| Columbia-Moberly-Mexico, MO CSA | 226,174 | 19,302 |
| Columbia-Orangeburg-Newberry, SC CSA | 937,794 | 338,375 |
| Columbus-Auburn-Opelika, GA-AL CSA | 504,052 | 176,115 |
| Columbus-Marion-Zanesville, OH CSA | 2,424,831 | 316,623 |
| Corpus Christi-Kingsville-Alice, TX CSA | 522,751 | 17,320 |
| Dallas-Fort Worth, TX-OK CSA | 7,503,731 | 1,124,617 |
| Davenport-Moline, IA-IL CSA | 475,363 | 29,511 |
| Dayton-Springfield-Sidney, OH CSA | 1,076,832 | 134,184 |
| Denver-Aurora, CO CSA | 3,418,876 | 161,462 |
| DeRidder-Fort Polk South, LA CSA | 87,265 | 12,763 |
| Des Moines-Ames-West Des Moines, IA CSA | 782,390 | 32,970 |
| Detroit-Warren-Ann Arbor, MI CSA | 5,319,913 | 1,096,353 |
| Dixon-Sterling, IL CSA | 91,663 | 3,617 |
| Dothan-Enterprise-Ozark, AL CSA | 248,947 | 54,907 |
| Eau Claire-Menomonie, WI CSA | 210,133 | 1,886 |
| Edwards-Glenwood Springs, CO CSA | 131,661 | 723 |
| El Paso-Las Cruces, TX-NM CSA | 1,052,314 | 35,319 |
| Elmira-Corning, NY CSA | 184,702 | 8,362 |
| Erie-Meadville, PA CSA | 364,529 | 22,078 |
| Fargo-Wahpeton, ND-MN CSA | 256,616 | 8,819 |
| Fayetteville-Lumberton-Laurinburg, NC CSA | 546,215 | 181,386 |
| Findlay-Tiffin, OH CSA | 131,183 | 3,269 |
| Fort Wayne-Huntington-Auburn, IN CSA | 626,124 | 42,127 |
| Fresno-Madera, CA CSA | 1,129,859 | 51,643 |
| Gainesville-Lake City, FL CSA | 345,229 | 65,239 |
| Grand Rapids-Wyoming-Muskegon, MI CSA | 1,433,288 | 95,762 |
| Green Bay-Shawano, WI CSA | 362,457 | 5,767 |
| Greensboro–Winston-Salem–High Point, NC CSA | 1,642,506 | 349,665 |
| Greenville-Spartanburg-Anderson, SC CSA | 1,426,066 | 261,696 |
| Greenville-Washington, NC CSA | 223,493 | 75,304 |
| Harrisburg-York-Lebanon, PA CSA | 1,247,235 | 89,334 |
| Harrisonburg-Staunton-Waynesboro, VA CSA | 251,352 | 13,048 |
| Hartford-West Hartford, CT CSA | 1,483,187 | 152,393 |
| Hickory-Lenoir, NC CSA | 407,499 | 24,856 |
| Hot Springs-Malvern, AR CSA | 130,603 | 11,943 |
| Houston-The Woodlands, TX CSA | 6,857,660 | 1,176,398 |
| Huntsville-Decatur-Albertville, AL CSA | 692,157 | 119,395 |
| Idaho Falls-Rexburg-Blackfoot, ID CSA | 236,486 | 219 |
| Indianapolis-Carmel-Muncie, IN CSA | 2,371,865 | 306,969 |
| Ithaca-Cortland, NY CSA | 153,420 | 3,484 |
| Jackson-Vicksburg-Brookhaven, MS CSA | 670,319 | 326,650 |
| Jacksonville-St. Marys-Palatka, FL-GA CSA | 1,573,606 | 335,762 |
| Johnson City-Kingsport-Bristol, TN-VA CSA | 506,193 | 12,614 |
| Johnstown-Somerset, PA CSA | 211,933 | 6,368 |
| Jonesboro-Paragould, AR CSA | 172,590 | 15,792 |
| Joplin-Miami, MO-OK CSA | 209,192 | 2,146 |
| Kalamazoo-Battle Creek-Portage, MI CSA | 530,672 | 46,814 |
| Kansas City-Overland Park-Kansas City, MO-KS CSA | 2,427,532 | 278,247 |
| Knoxville-Morristown-Sevierville, TN CSA | 1,109,429 | 55,515 |
| Kokomo-Peru, IN CSA | 118,418 | 7,170 |
| Lafayette-Opelousas-Morgan City, LA CSA | 627,146 | 170,718 |
| Lafayette-West Lafayette-Frankfort, IN CSA | 247,606 | 9,500 |
| Lansing-East Lansing-Owosso, MI CSA | 540,895 | 39,841 |
| Las Vegas-Henderson, NV-AZ CSA | 2,362,015 | 235,481 |
| Lexington-Fayette–Richmond–Frankfort, KY CSA | 719,949 | 65,661 |
| Lima-Van Wert-Celina, OH CSA | 219,831 | 14,631 |
| Lincoln-Beatrice, NE CSA | 345,457 | 12,740 |
| Little Rock-North Little Rock, AR CSA | 903,900 | 220,611 |
| Longview-Marshall, TX CSA | 284,527 | 54,714 |
| Los Angeles-Long Beach, CA CSA | 18,679,763 | 1,231,312 |
| Louisville/Jefferson County–Elizabethtown–Madison, KY-IN CSA | 1,504,754 | 195,973 |
| Lubbock-Levelland, TX CSA | 335,866 | 20,528 |
| Macon-Warner Robins, GA CSA | 419,401 | 161,147 |
| Madison-Janesville-Beloit, WI CSA | 866,475 | 34,589 |
| Manhattan-Junction City, KS CSA | 135,575 | 10,595 |
| Mankato-New Ulm-North Mankato, MN CSA | 124,447 | 3,380 |
| Mansfield-Ashland-Bucyrus, OH CSA | 217,226 | 8,498 |
| Martin-Union City, TN-KY CSA | 70,211 | 7,170 |
| Mayagüez-San Germán, PR CSA | 227,075 | 5,646 |
| McAllen-Edinburg, TX CSA | 906,099 | 5,761 |
| Medford-Grants Pass, OR CSA | 297,312 | 1,884 |
| Memphis-Forrest City, TN-MS-AR CSA | 1,370,161 | 641,036 |
| Miami-Fort Lauderdale-Port St. Lucie, FL CSA | 6,654,313 | 1,377,806 |
| Midland-Odessa, TX CSA | 324,863 | 15,577 |
| Milwaukee-Racine-Waukesha, WI CSA | 2,046,692 | 286,014 |
| Minneapolis-St. Paul, MN-WI CSA | 3,866,768 | 291,493 |
| Mobile-Daphne-Fairhope, AL CSA | 619,104 | 168,205 |
| Modesto-Merced, CA CSA | 806,843 | 23,644 |
| Monroe-Ruston-Bastrop, LA CSA | 253,407 | 97,592 |
| Montgomery-Alexander City, AL CSA | 427,439 | 174,583 |
| Morgantown-Fairmont, WV CSA | 195,101 | 7,232 |
| Moses Lake-Othello, WA CSA | 112,514 | 539 |
| Mount Pleasant-Alma, MI CSA | 112,238 | 4,507 |
| Myrtle Beach-Conway, SC-NC CSA | 493,262 | 73,728 |
| Nashville-Davidson–Murfreesboro, TN CSA | 1,951,597 | 283,660 |
| New Bern-Morehead City, NC CSA | 193,945 | 32,244 |
| New Orleans-Metairie-Hammond, LA-MS CSA | 1,493,205 | 499,625 |
| New York-Newark, NY-NJ-CT-PA CSA | 23,723,696 | 3,813,973 |
| North Port-Sarasota, FL CSA | 977,491 | 68,181 |
| Oklahoma City-Shawnee, OK CSA | 1,430,327 | 138,779 |
| Omaha-Council Bluffs-Fremont, NE-IA CSA | 952,263 | 71,834 |
| Orlando-Deltona-Daytona Beach, FL CSA | 3,129,308 | 458,892 |
| Paducah-Mayfield, KY-IL CSA | 136,018 | 12,221 |
| Parkersburg-Marietta-Vienna, WV-OH CSA | 153,888 | 1,836 |
| Peoria-Canton, IL CSA | 412,686 | 36,764 |
| Philadelphia-Reading-Camden, PA-NJ-DE-MD CSA | 7,183,479 | 1,396,166 |
| Phoenix-Mesa-Scottsdale, AZ Metro Area | 4,407,915 | 227,743 |
| Pittsburgh-New Castle-Weirton, PA-OH-WV CSA | 2,649,496 | 198,858 |
| Ponce-Coamo-Santa Isabel, PR CSA | 399,540 | 30,660 |
| Portland-Lewiston-South Portland, ME CSA | 633,528 | 10,296 |
| Portland-Vancouver-Salem, OR-WA CSA | 3,111,922 | 73,876 |
| Pueblo-Cañon City, CO CSA | 210,283 | 5,959 |
| Pullman-Moscow, WA-ID CSA | 86,955 | 1,328 |
| Quincy-Hannibal, IL-MO CSA | 116,319 | 3,985 |
| Raleigh-Durham-Chapel Hill, NC CSA | 2,117,103 | 488,725 |
| Rapid City-Spearfish, SD CSA | 170,176 | 1,211 |
| Redding-Red Bluff, CA CSA | 242,841 | 2,940 |
| Reno-Carson City-Fernley, NV CSA | 605,954 | 11,309 |
| Richmond, VA Metro Area | 1,246,215 | 373,687 |
| Richmond-Connersville, IN CSA | 91,100 | 3,211 |
| Rochester-Austin, MN CSA | 252,989 | 9,150 |
| Rochester-Batavia-Seneca Falls, NY CSA | 1,175,724 | 131,124 |
| Rockford-Freeport-Rochelle, IL CSA | 438,071 | 42,850 |
| Rocky Mount-Wilson-Roanoke Rapids, NC CSA | 302,665 | 141,022 |
| Rome-Summerville, GA CSA | 122,370 | 17,659 |
| Sacramento-Roseville, CA CSA | 2,544,026 | 166,145 |
| Saginaw-Midland-Bay City, MI CSA | 382,598 | 37,452 |
| Salt Lake City-Provo-Orem, UT CSA | 2,468,347 | 31,150 |
| San Antonio-New Braunfels, TX Metro Area | 2,286,702 | 151,999 |
| San Diego-Carlsbad, CA Metro Area | 3,223,096 | 163,276 |
| San Jose-San Francisco-Oakland, CA CSA | 8,713,914 | 522,023 |
| San Juan-Carolina, PR CSA | 2,495,780 | 296,411 |
| Savannah-Hinesville-Statesboro, GA CSA | 530,661 | 177,149 |
| Seattle-Tacoma, WA CSA | 4,602,591 | 232,852 |
| Sioux City-Vermillion, IA-SD-NE CSA | 178,572 | 3,937 |
| South Bend-Elkhart-Mishawaka, IN-MI CSA | 725,065 | 70,792 |
| Spokane-Spokane Valley-Coeur d’Alene, WA-ID CSA | 697,153 | 8,248 |
| Springfield-Branson, MO CSA | 540,609 | 12,156 |
| Springfield-Greenfield Town, MA CSA | 702,583 | 46,504 |
| Springfield-Jacksonville-Lincoln, IL CSA | 314,958 | 28,555 |
| St. Louis-St. Charles-Farmington, MO-IL CSA | 2,917,172 | 516,710 |
| State College-DuBois, PA CSA | 241,574 | 8,919 |
| Syracuse-Auburn, NY CSA | 738,746 | 58,319 |
| Tallahassee-Bainbridge, FL-GA CSA | 405,612 | 138,885 |
| Tampa-St. Petersburg-Clearwater, FL Metro Area | 2,888,458 | 346,574 |
| Toledo-Port Clinton, OH CSA | 646,833 | 85,600 |
| Tucson-Nogales, AZ CSA | 1,056,486 | 36,801 |
| Tulsa-Muskogee-Bartlesville, OK CSA | 1,150,961 | 89,219 |
| Tyler-Jacksonville, TX CSA | 274,478 | 45,970 |
| Victoria-Port Lavaca, TX CSA | 120,935 | 7,705 |
| Virginia Beach-Norfolk, VA-NC CSA | 1,827,009 | 549,774 |
| Visalia-Porterville-Hanford, CA CSA | 610,828 | 15,911 |
| Washington-Baltimore-Arlington, DC-MD-VA-WV-PA CSA | 9,625,744 | 2,416,074 |
| Wausau-Stevens Point-Wisconsin Rapids, WI CSA | 307,691 | 2,078 |
| Wichita-Arkansas City-Winfield, KS CSA | 680,290 | 53,990 |
| Williamsport-Lock Haven, PA CSA | 155,489 | 6,443 |
| Youngstown-Warren, OH-PA CSA | 654,691 | 62,989 |
______________
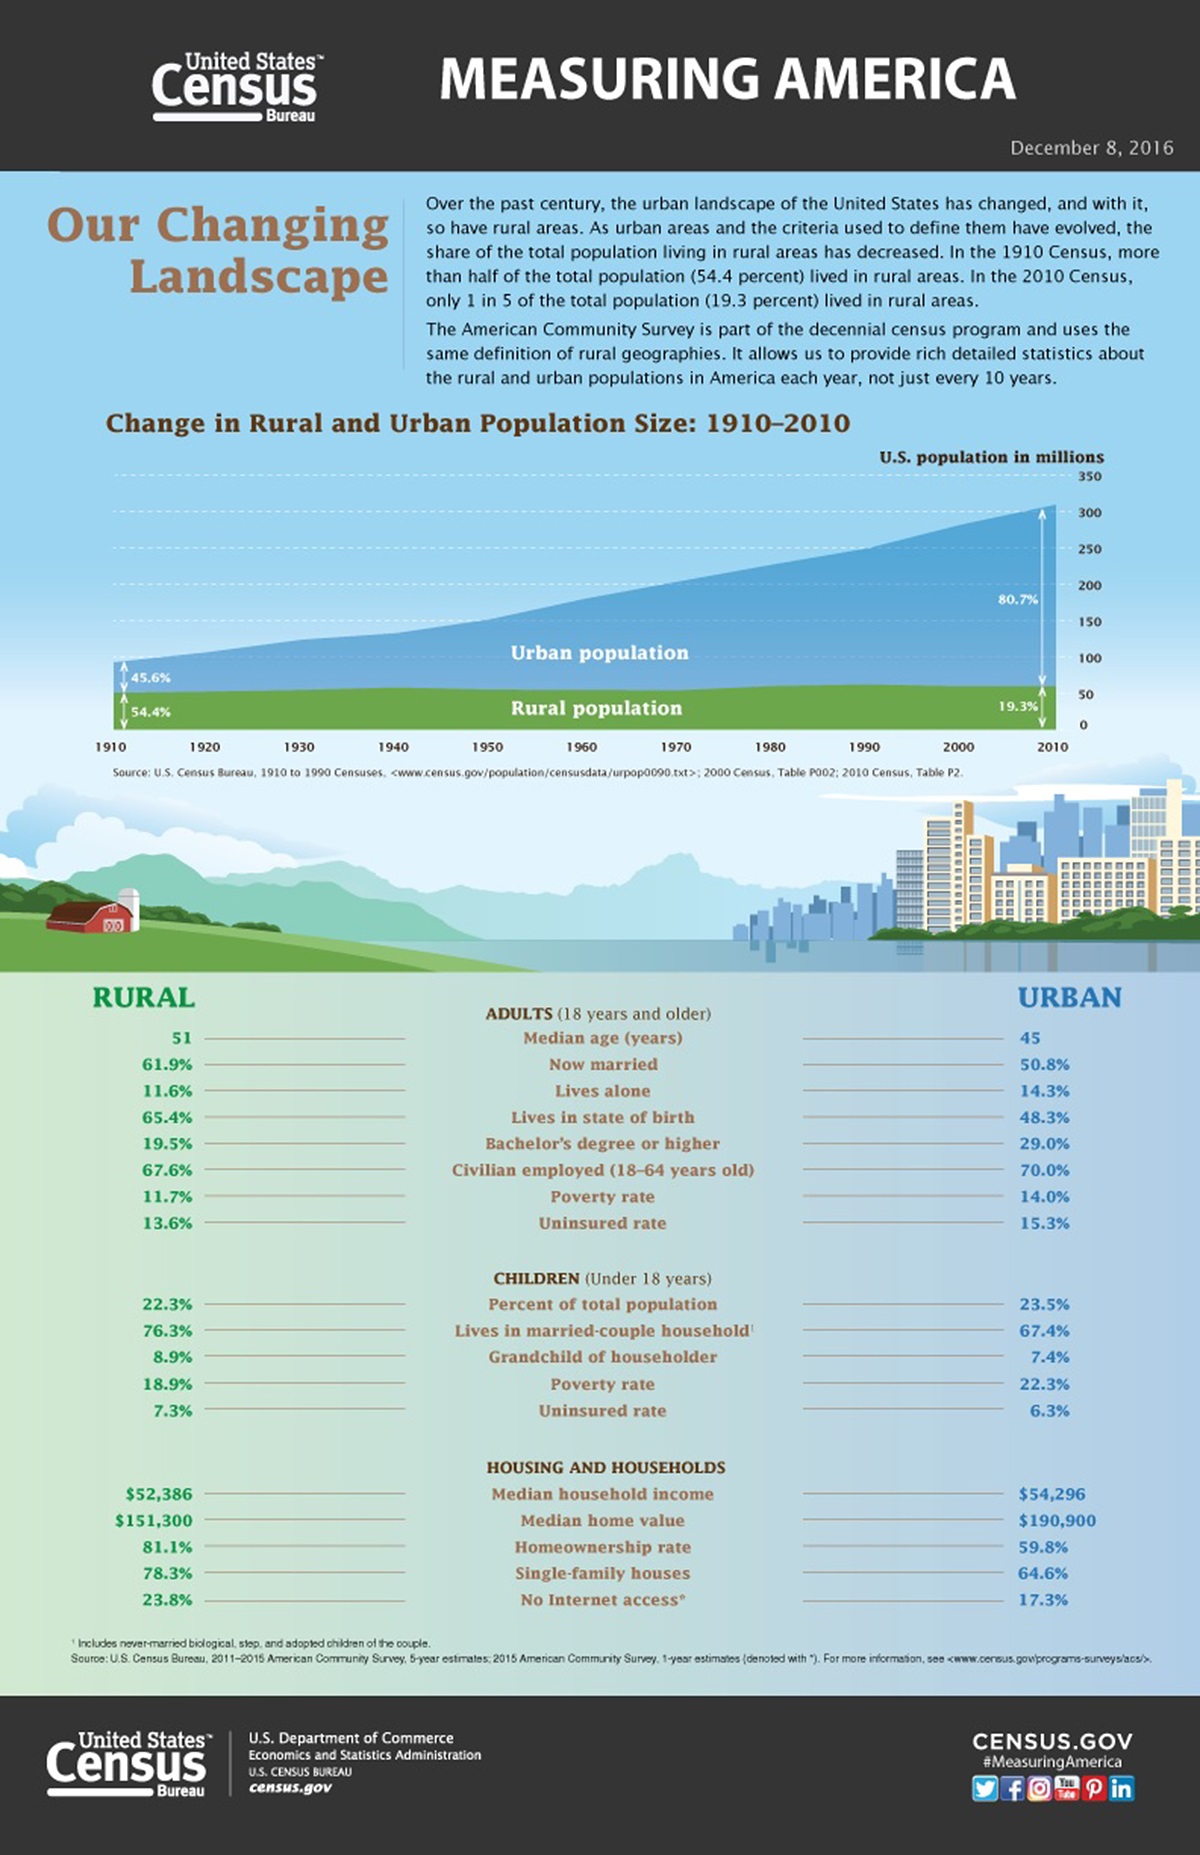
Differences between the rural areas and urban areas of United States
“Rural areas cover 97 percent of the nation’s land area but contain 19.3 percent of the population (about 60 million people),” Census Bureau Director John H. Thompson said in a statement. The nation’s urban populations have increased while rural populations have declined.
Donald J. Trump won the presidential election largely on the strength of the rural vote winning the Electoral College. Hillary Clinton won most of America’s metropolitan urban areas.
Click image below to enlarge


December 9, 2016
Business, Did you know?, Government/Politics