United States: Demographic profile of the military community
This report is published by the United States Department of Defense (DoD), Office of the Deputy Assistant Secretary of Defense for Military Community and Family Policy (ODASD (MC&FP)), under contract with ICF.
This is a synthesis of demographic information describing members and families in the military community in fiscal year 2015.1 Active Duty Service branches include DoD’s Army, Navy, Marine Corps, and Air Force; and the Reserve components include DoD’s Army National Guard, Army Reserve, Navy Reserve, Marine Corps Reserve, Air National Guard and Air Force Reserve, and DHS’s Coast Guard Reserve.
The total number of military personnel is over 3.5 million strong, including DoD Active Duty military personnel (1,301,443); DHS’s Active Duty Coast Guard members (39,090); DoD Ready Reserve and DHS Coast Guard Reserve members (1,101,353); members of the Retired Reserve (216,370) and Standby Reserve (9,899); and DoD Appropriated and Non-Appropriated Funds civilian personnel (865,019). DoD’s Active Duty and DHS’s Coast Guard Active Duty members comprise the largest portion of the military force (37.9%), followed by Ready Reserve members (31.2%) and DoD civilian personnel (24.5%).
Overview of Military Personnel
The total number of military personnel is over 3.5 million strong, including DoD Active Duty military personnel (1,301,443); DHS’s Active Duty Coast Guard members (39,090); DoD Ready Reserve and DHS Coast Guard Reserve members (1,101,353); members of the Retired Reserve (216,370) and Standby Reserve (9,899); and DoD Appropriated and Non-Appropriated Funds civilian personnel (865,019). DoD’s Active Duty and DHS’s Coast Guard Active Duty members comprise the largest portion of the military force (37.9%), followed by Ready Reserve members (31.2%) and DoD civilian personnel (24.5%).
Active Duty Member Highlights
Service Branches
The Army has the largest number of Active Duty members (487,366) followed by the
Navy (323,334), the Air Force (307,326), and the Marine Corps (183,417). At a total of 1,301,443 DoD Active Duty members, the military force of 2015 is 5.1% smaller than it was in 2000, when there were 1,370,678 Active Duty members. From 2000 to 2015, the Navy (-12.0%) and Air Force (-12.5%) experienced a decrease in the number of members, while the Army (+1.7%) and Marine Corps (+6.0%) experienced an increase in the number of members.
Ratio of Ranks. The DoD Active Duty force is composed of 82.3 percent enlisted personnel (1,070,653) and 17.7 percent officers (230,790). Overall, the Active Duty force has 4.6 enlisted personnel for every one officer. In comparison, the Air Force has one officer for every 4.0 enlisted personnel, the Army has one officer for every 4.1 enlisted personnel, the Navy has one officer for every 5.0 enlisted personnel, and the Marine Corps has one officer for every 7.9 enlisted personnel.
Gender
Women, who number 201,413, comprise 15.5 percent of the DoD Active Duty force, while 1,100,030 men comprise 84.5 percent of the DoD Active Duty force. Compared to 2000, both the percentage of Active Duty enlisted members and the percentage of Active Duty officers who are women has increased (from 14.7% and 14.4%, respectively, in 2000 to 15.1% and 17.0%, respectively, in 2015).
Overall, the number and ratio of female enlisted members (162,187) to female officers (39,226) is 4.1 female enlisted members for every one female officer, while the number and ratio of male enlisted members (908,466) to male officers (191,564) is 4.7 male enlisted members for every one male officer.
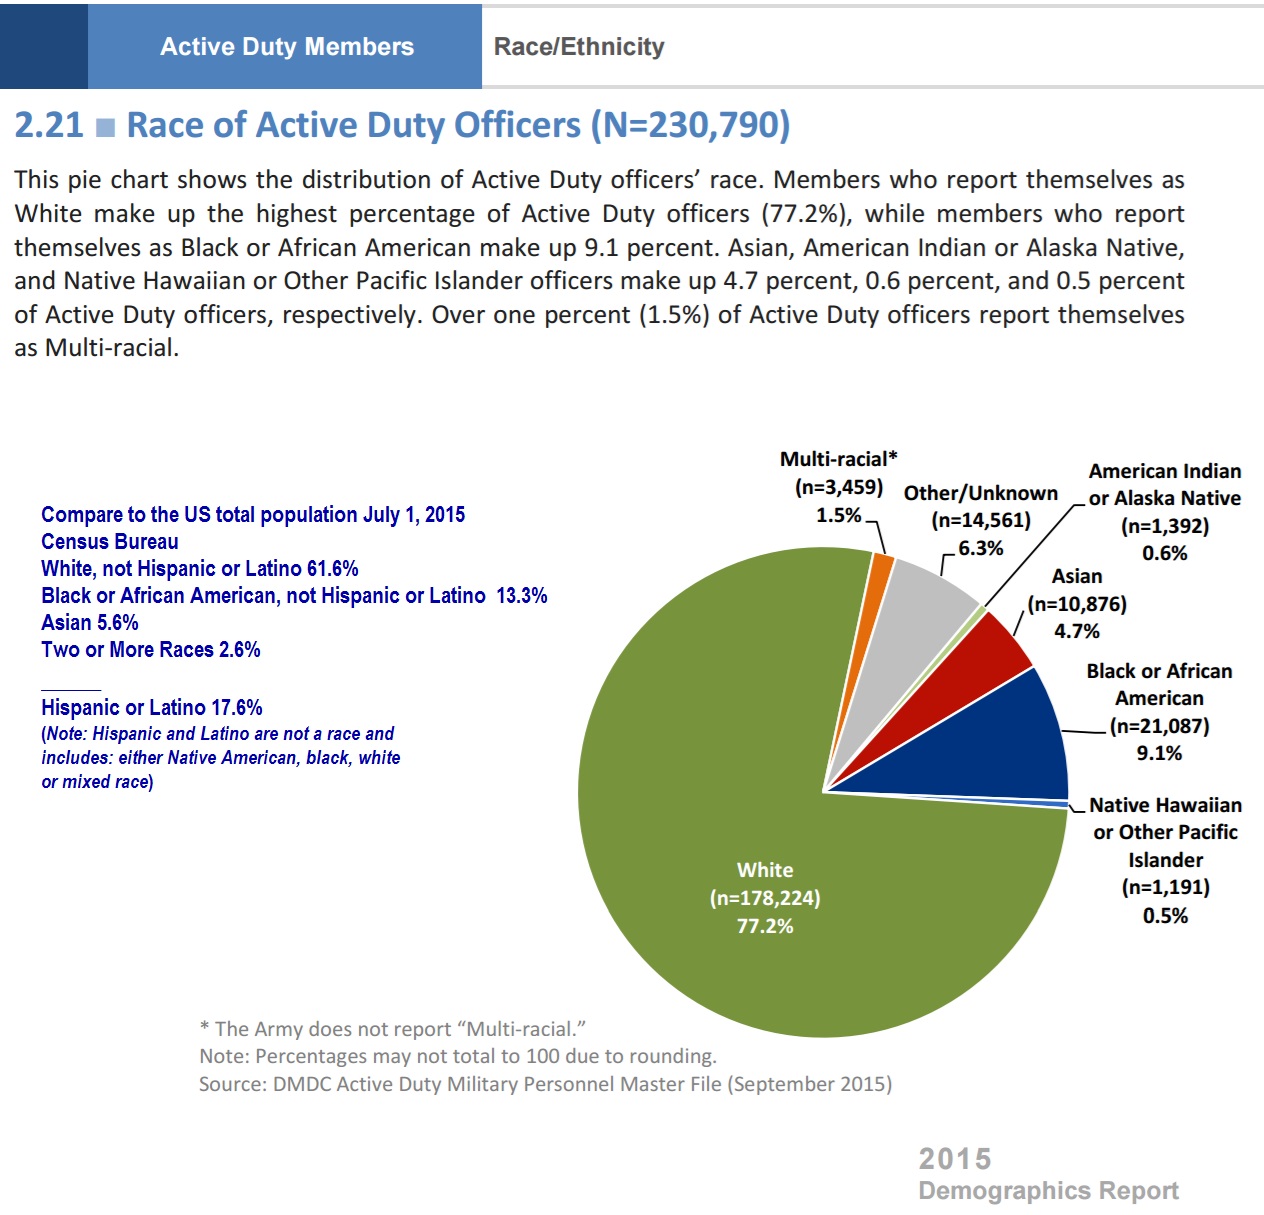
Race/Ethnicity. Less than one-third (31.3%) or 407,563 of Active Duty members identify themselves as a racial minority (i.e., Black or African American, Asian, American Indian or Alaska Native, Native Hawaiian or Other Pacific Islander, Multi-racial, or Other/Unknown). The percentage of Active Duty members who identify themselves as a racial minority has increased each year since 2012 (from 31.6% of enlisted members and 21.9% of officers in 2012, to 33.2% of enlisted members and 22.8% of officers in 2015).
The overall ratio of racial minority enlisted personnel (354,997) to racial minority officers (52,566) is 6.8 racial minority enlisted personnel for every one racial minority officer.
To conform to the latest Office of Management and Budget (OMB) directives, Hispanic/Latino is not considered a minority race designation and only Active Duty members’ race was used to determine racial minority status.
Geographic Location
While the Active Duty population is located throughout the world, the three
primary areas in which Active Duty members are assigned are the United States and its territories (87.5%), East Asia (6.5%), and Europe (5.1%).
The ten states with the highest Active Duty military
populations are: California (150,563), Virginia (124,197), Texas (116,549), North Carolina (99,981), Georgia (68,191), Florida (59,376), Washington (57,008), Hawaii (45,367), South Carolina (36,521), and Colorado (35,712). Active Duty members in these ten states comprise 70.1 percent of the personnel stationed in the United States.
Age
One half (50.3%) of Active Duty enlisted personnel are 25 years of age or younger, with the next largest age group being 26 to 30 years (21.7%), followed by 31 to 35 years (14.0%), 36 to 40 years (8.8%), and those 41 years or older (5.3%). More than one-quarter (25.3%) of Active Duty officers are 41 years of age or older, with the next largest age group being 26 to 30 years (22.4%), followed by 31 to 35 years (20.8%), 36 to 40 years (17.7%), and those 25 years or younger (13.8%). Overall, the average age of the Active Duty force is 28.5 years. The average age for Active Duty enlisted personnel is 27.2 years, and the average age for Active Duty officers is 34.7 years.
Education Level
Few enlisted members (7.6%) have a Bachelor’s degree or higher, while most (91.6%) have a high school diploma and/or some college experience but less than a Bachelor’s degree. The majority (83.8%) of officers have a Bachelor’s or higher degree. Compared to 2000, the percentage of total Active Duty members who have a Bachelor’s and/or an advanced degree increased for enlisted personnel (from 3.3% in 2000 to 7.6% in 2015) but has decreased for officers (from 89.9% in 2000, to 83.8% in 2015).
Marital Status
Just over half (54.3%) of Active Duty military members are married, which is higher than the percentage that were married in 2000 (53.1%). In 2015, over half (51.1%) of enlisted members and a majority (69.6%) of officers report themselves as married. Over half (56.0%) of Active Duty males and nearly half (45.3%) of Active Duty females are married. In addition, 6.4 percent of DoD’s Active Duty members are in dual-military marriages.
During the 2015 fiscal year, 3.4 percent of enlisted personnel and 1.6 percent of officers are estimated to have divorced.


See entire report
2015-Demographic profile of the U.S. military community


April 17, 2017
Africa, Did you know?, Government/Politics