United States: Who are the members of the 115th Congress?

Source: Congressional Research Service
A profile of the membership of the 115th Congress (2017-2018) as of January 3, 2018. Statistical information is included on selected characteristics of Members, including data on party affiliation, average age, occupation, education, length of congressional service, religious affiliation, gender, ethnicity, foreign births, and military service.
Congress is composed of 541 individuals from the 50 states, the District of Columbia, Guam, the U.S. Virgin Islands, American Samoa, the Northern Mariana Islands, and Puerto Rico.
Since 1789, 12,247 individuals have served in Congress, 10,946 in the House and 1,973 in the Senate. Of these Members, 672 have served in both chambers. These numbers do not include an additional 177 individuals who have served only as territorial Delegates or as Resident Commissioners from Puerto Rico or the Philippines in the House.
At the beginning of the 115th Congress, 52 of the House Members, including the Resident Commissioner for Puerto Rico (11.8% of the total House Membership), had first been elected to the House in November 2016, and 7 of the Senators (7% of the total Senate membership) had first been elected to the Senate in November 2016. These numbers are lower than at the beginning of the 114th Congress, when 13.8% of the House and 13% of the Senate were newly elected “freshmen.”
At the beginning of the 115th Congress, 116 House Members, including 2 Delegates and the Resident Commissioner (26% of House Members), had no more than two years of House experience, and 21 Senators (21% of Senators) had no more than two years of Senate experience
In the House of Representatives, there are 240 Republicans (including 1 Delegate and the Resident Commissioner of Puerto Rico), 197 Democrats (including 4 Delegates), and 4 vacant seats. The Senate has 51 Republicans, 47 Democrats, and 2 Independents, who both caucus with the Democrats.
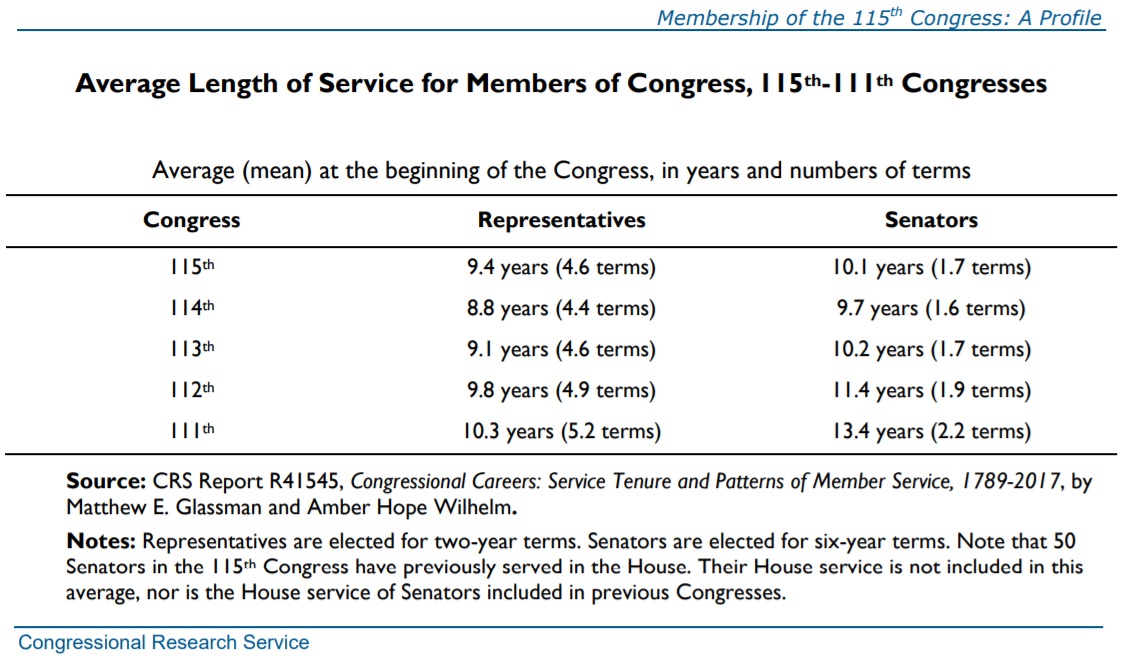
The average length of service for Representatives at the beginning of the 115th Congress was 9.4 years (4.7 House terms); for Senators, 10.1 years (1.7 Senate terms).
The average age of Members of the House at the beginning of the 115th Congress was 57.8 years.
The average age of U.S. Senators was 61.8 years, among the oldest in U.S. history.
Age

Of the 100 US Senators:
73 are from the Silent Generation and Baby Boomers (1946 to 1960).
Only 27 are from Generation X (1961 to 1981).
There are no Millennials (1982 to 2000).
__
Silent Generation: 19
19 are age 73 to 84, born between 1933 to 1944
(There is no one in Congress born in the year 1945)
12 Republican
5 Democratic 2 Independent
__
Baby Boomers: 54
54 are age 57 to 71, born between 1946 to 1960
23 Republicans
29 Democrats
__
Generation X: 27
13 are age 51 to 57, born between 1961 to 1966
(There is no one in Congress born in the year 1967)
7 Republicans
6 Democrats
14 are age 40 to 49 born between 1968 to 1977
9 Republicans
5 Democrats
___________________
Of the 435 (4 vacant) United States House of Representatives:
238 Republican
193 Democratic
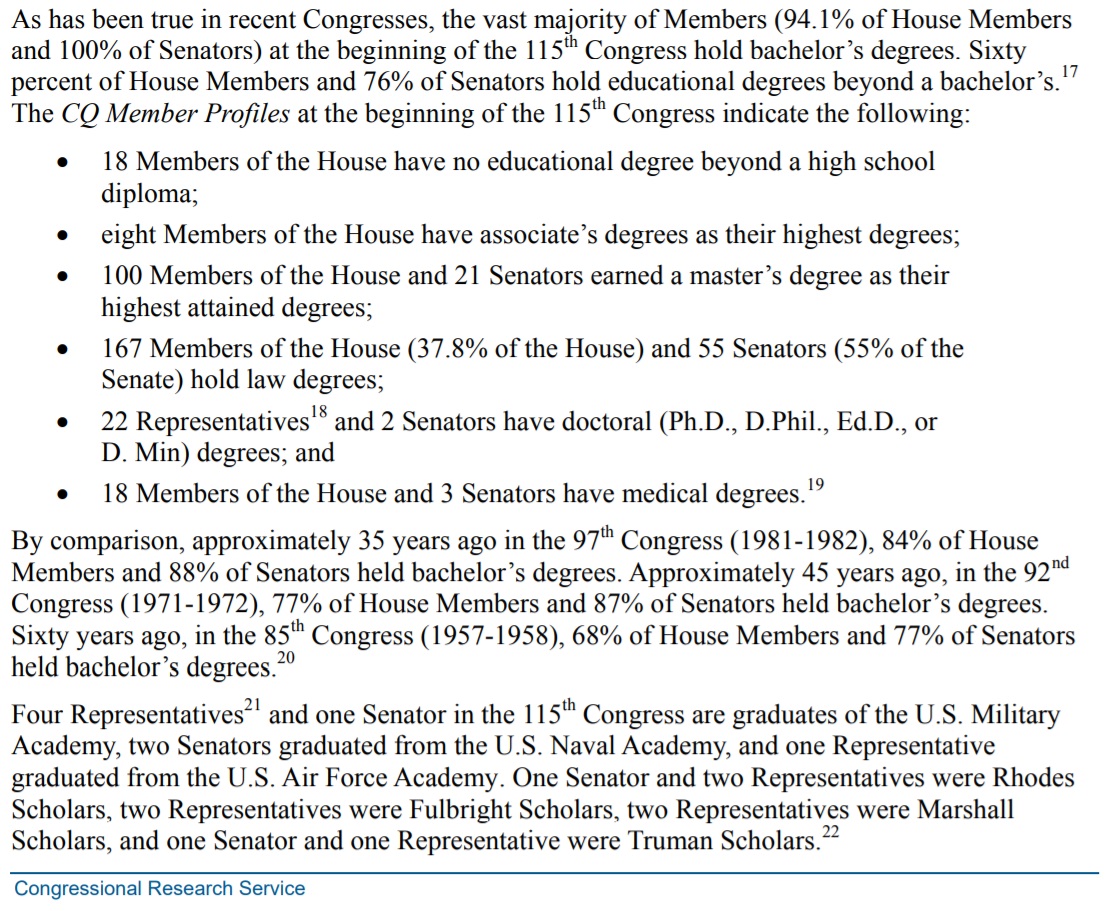
The overwhelming majority of Members of Congress have a college education.
The dominant professions of Members are public service/politics, business, and law.
Most Members identify as Christians, and Christian Protestants collectively constitute the majority religious affiliation.
Christian Roman Catholics account for the largest single religious denomination.
Numerous other affiliations are represented, including Jewish, Mormon, Buddhist, Muslim, Hindu, Greek Orthodox, Pentecostal Christian, Unitarian Universalist, and Christian Science.
A record number of women
One hundred eleven (111) women, a record number, serve in the 115th Congress: 89 in the U.S. House of Representatives, including 5 Delegates and the Resident Commissioner, and 22 in the U.S. Senate.
There are 48 African American members of the U.S. House of Representatives out of the total 435 seats.
For the first time ever, in the history of the United States, there are 3 African American members in the U.S. Senate.
There are a record 51 African American Members (9.4% of the total membership) in the 115th Congress, 3 more than at the beginning of the 114th Congress.
Forty-eight (48) serve in the U.S. House of Representatives, including 2 Delegates, and 3 serve in the Senate. This number includes one Representative, as well as one (1) U.S. Senator, who are of African American and Asian ancestry, and one Representative who is of African American and Hispanic/Latino ancestry. Each of these 3 Members is counted as belonging to two ethnic groups. Hispanic or Latino are not a race or a single ethnic group.
Forty-six (456) of the African American House Members, including 2 Delegates, are Democrats, and 2 are Republicans. Two (2) U.S. Senators are Democrats and one (1) is Republican. Twenty (20) African American women, including two (2) Delegates, serve in the U.S. House of Representatives, and one serves in the U.S. Senate.
African American U.S. Senators
Reconstruction Era
Pinckney Benton Stewart Pinchback (Republican), Louisiana. He was elected to the U.S. Senate, but not seated.
Before ascending to the office of governor, Pinchback had run for both a U.S Senate seat and a seat in the U.S. House of Representatives simultaneously in 1872. He won both contests but was barred from taking his congressional post when his opponent contested the election and was awarded the position.
In New Orleans, Pinchback organized the Fourth Ward Republican Club, and was a member of the delegation that established a new constitution for the state of Louisiana in 1868. Also, in 1868 Pinchback was elected to the Louisiana State Senate, and subsequently became the institution’s president pro tempore.
In 1871, the Lieutenant Governor of Louisiana, Oscar Dunn, died of pneumonia and Pinchback was selected and became Louisiana’s Lieutenant Governor. He served as lieutenant governor until the winter of 1872 when impeachment proceedings were initiated against Governor Henry Clay Warmouth. Pinchback became the 24th Governor of Louisiana from December 9, 1872 – January 13, 1873. Pinchback was the first person of African descent to serve as governor of any U.S. state.
Pinchback helped establish Southern University when, in the Constitutional Convention of 1879, he pushed for the creation of a college for African Americans in Louisiana.
Pinchback relocated to New York City in the 1890s. He served as U.S. Marshall from 1892 to 1895. He finally relocated to Washington, D.C.
Hiram Rhodes Revels (Republican), Mississippi (Term: February 25, 1870 to March 3, 1871)
Blanche Bruce (Republican), Mississippi (Term: March 4, 1875 to March 3, 1881)
Post Reconstruction Era
Edward Brooke (Republican), Massachusetts (Term: January 3, 1967 to January 3, 1979)
Carol Moseley Braun (Democratic), Illinois (Term: January 3, 1993 to January 3, 1999)
Barack Obama (Democratic), Illinois (Term: January 3, 2005 to November 16, 2008)
Roland Burris (Democratic), Illinois (Term: January 15, 2009 to November 29, 2010)
Tim Scott (Republican), South Carolina (Term: January 2, 2013 to Current)
Mo Cowan (Democratic), Massachusetts (Term: February 1, 2013 to July 16, 2013)
Cory Booker (Democratic), New Jersey (Term: October 31, 2013 to Current)
Kamala Harris (Democratic), California (Term: January 3, 2017 to Current)
This U.S. House of Representatives number includes 2 Delegates.
Hispanic or Latino Members (of any race)
There are 46 Hispanic or Latino Members (a record number) serving: 41 in the U.S. House of Representatives,
including 1 Delegate and the Resident Commissioner, and 5 in the U.S.Senate.
The 46 Hispanic or Latino Members in the 115th Congress represent 8.5% of the total membership.
Of the 41 serve in the U.S. House of Representatives and 5 in the U.S. Senate one (1) House Member is also of Asian descent, and one House Member of African ancestry; these Members are counted in both ethnic categories. Of the Members of the House, 30 are Democrats (including 1 Delegate) and 11 are Republicans (including the Resident
Commissioner). Ten (10) are women, including the Resident Commissioner. Of the five Hispanic/Latino Senators (3 Republicans, 2 Democrats), one (1) is a woman.
Asian Americans, Indian Americans, or Pacific Islander Americans
Eighteen (18) Members (13 U.S. House of Representatives, 2 Delegates, and 3 U.S. Senators) are Asian Americans, Indian Americans, or Pacific Islander Americans. This is also a record number.
The 18 Members of the 115th Congress represent 3.3% of the total membership.
Fifteen (15) of them (14 Democrats, 1 Republican) serve in the U.S. House of Representatives, and 3 (all Democrats) serve in the U.S. Senate. These numbers include one (1) U.S. House of Representatives Member and one (1) U.S. Senator who are also of African American ancestry, and another House Member of Hispanic/Latino (of any race) ancestry; these Members are counted in both ethnic categories in this report. Of those serving in the House, two are Delegates. Eleven (11) of the Asian, Pacific Islander, or South Asian American Members are female: 8 in the House and all 3 in the Senate.
Native Americans (American Indians)
Two (2) American Native Americans (American Indians) serve in the U.S. House of Representatives.
The 2 Native Americans (American Indians) Members of the 115th Congress are Republican Members of the U.S. House of Representatives.
Foreign Birth
Eighteen (18) U.S. House of Representatives and 5 U.S. Senators (4.2% of the 115th Congress) were born outside the
United States. Their places of birth include Canada, Cuba, Guatemala, Japan, Peru, and India.
Some of these Members were born to American citizens working or serving abroad. The U.S. Constitution requires that Representatives be citizens for seven (7) years and Senators be citizens for nine (9) years before they take office.
Military Service
At the beginning of the 115th Congress, there were 102 Members (18.8% of the total membership) who had served or were serving in the military, 1 more than at the beginning of the 114th Congress (101 Members), but 6 fewer than at the beginning of the 113th Congress (108 Members).
According to lists compiled by CQ, the U.S. House of Representatives currently has 79 veterans (including 2 female Members, as well as 1 Delegate); the U.S. Senate has 19 veterans, including 2 women. These Members served in the Korean War, the Vietnam War, the Persian Gulf War, and combat or peacekeeping missions in Afghanistan, Iraq, and Kosovo, as well as during times of peace. Seven (7) House Members and one (1) Senator are still serving in the reserves, and seven (7) House Members are still serving in the National Guard. All of the female veterans are combat veterans.


Education


January 20, 2018
Did you know?, Government/Politics