See Update: U.S. Census Bureau metropolitan population estimates July 1, 2018 –Release Date: April 18, 2019
U.S. Census Bureau metropolitan population estimates July 1, 2018 –Release Date: April 18, 2019
U.S. Census Bureau metropolitan population estimates July 1, 2017 –Release Date: March 22, 2018

Source: U.S. Census Bureau
The Dallas-Fort Worth-Arlington metropolitan area’s 146,000-population increase last year was the most of any metro area and Maricopa County, Ariz., saw a population increase of nearly 74,000 — the most of any county last year — according to the U.S. Census Bureau’s July 1, 2017, population estimates released today. The statistics provide population estimates and components of change for the nation’s 382 metropolitan statistical areas, 551 micropolitan statistical areas and 3,142 counties.
Among the nation’s counties, the top 10 with the largest numeric growth are all located in the South and the West. The 10 largest counties in the country all maintained their rank compared to last year.
From July 1, 2016, to July 1, 2017, six of the top 10 largest-gaining counties were in Texas — Bexar, Collin, Dallas, Denton, Harris and Tarrant. The remaining four counties on the list were Maricopa County, Ariz.; Clark County, Nev.; Riverside County, Calif.; and King County, Wash. Most of the nation’s 3,142 counties grew, with 57 percent gaining in the last year.
Counties
Gaining and losing population
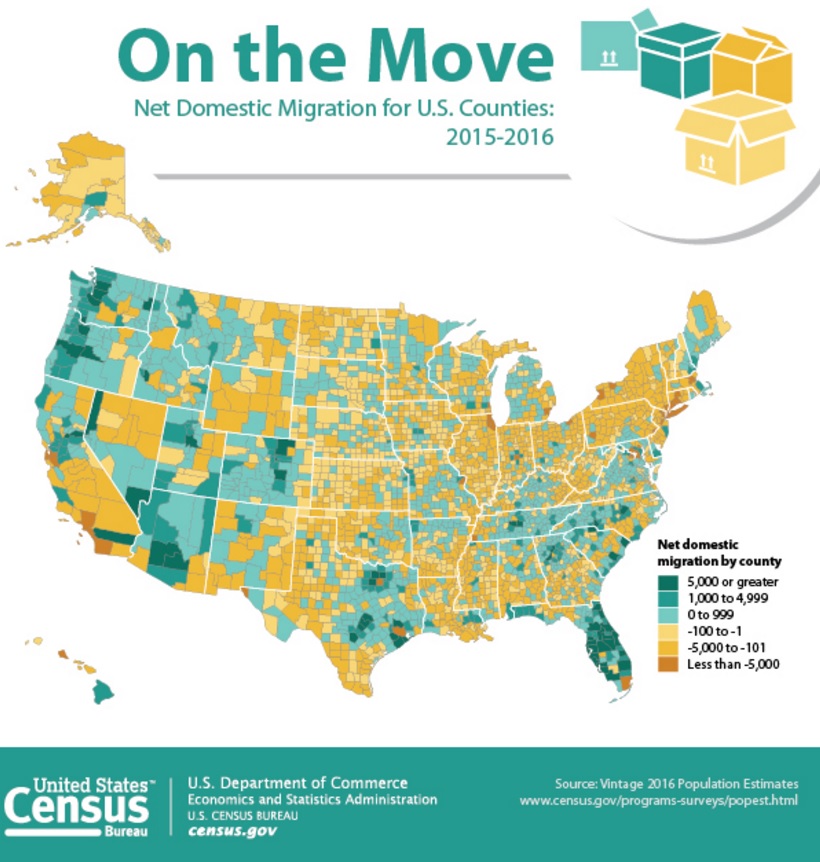
Between 2016 and 2017, 1,790 counties (57.0 percent) gained population and 1,342 counties (42.7 percent) lost population. This compared to 2015-2016, when 1,655 counties (52.7 percent) gained population and 1,480 counties (47.1 percent) lost population.
Among counties with a population of 10,000 or more in 2016 and 2017, Falls Church City, Va. (a county equivalent), was the fastest-growing county with a 5.2 percent increase, adding 715 people. The rapid growth was mostly due to an increase in net domestic migration, with 492 more people moving in than out of the area between 2016 and 2017.
The primary driver behind the growth of the 10 fastest-growing counties, 2016-2017, was net domestic migration.
Metropolitan Areas
Growth
Many of the top 10 metro areas with the largest numeric increases in 2015-2016 were also in the top 10 in 2016-2017, with the following notable exceptions: Washington-Arlington-Alexandria, DC-Va.-Md.-W.Va., climbed to 5th in 2017 from 11th in 2016, and Riverside-San Bernardino-Ontario, Calif., jumped to 7th in 2017 from 13th in 2016.
In 2017, the Baltimore metro area was now the 20th most populous metro area, up from 21st place in 2016.
Net domestic migration is the driving factor behind all of the top 10 fastest-growing metro areas that rose in rank — St. George, Utah; Coeur d’Alene, Idaho; Greely, Colo.; Lakeland, Fla.; and Boise, Idaho.
Decrease
Out of 382 metro areas, 87 (22.8 percent) saw population decreases between 2016 and 2017.
The metro areas that dropped in rank within the top 10 fastest-growing metro areas, between 2016 and 2017, did so because of decreases in net domestic migration. Those areas are Bend-Redmond, Ore.; Provo-Orem, Utah; The Villages, Fla.; Cape Coral-Fort Myers, Fla.; and Austin-Round Rock, Texas.
The St. Louis, Mo.-Ill. metro area dropped out of the top 20 most populous metro areas and swapped places with Baltimore to its new 2017 standing of the 21st most populous area in the nation. In 1960, St Louis was the 9th largest metro area.
A decrease in net domestic migration, meaning less of a gain from movement within the United States, was the primary factor in the Tampa metro area’s drop in rank from 7th in 2016 to 10th in 2017.
The metro area with the largest percentage decrease in population last year was Casper, Wyo., down by 1.7 percent.
Puerto Rico
The estimates show that Puerto Rico had an estimated population of 3.3 million in 2017, a decrease from 3.4 million in 2016. Puerto Rico’s population loss is attributed to a large migration of Puerto Ricans to the mainland United States.
All municipios in Puerto Rico decreased in population in 2015-2016 and 2016-2017.
The municipio with the largest numeric decrease between 2016 and 2017 was San Juan Municipio (-9,246; -2.7 percent), followed by Bayamón Municipio (-4,648; -2.5 percent), and Ponce Municipio (-4,140; -2.9 percent).
The municipio with the largest percentage decrease between 2016 and 2017 was Lares Municipio (-792; -3.0 percent), followed by Peñuelas Municipio (-628; -3.0 percent), and Guánica Municipio (-501; -3.0 percent).
Combined statistical areas (CSA) consist of two or more adjacent metropolitan and micropolitan statistical areas that have substantial employment interchange. The metropolitan and micropolitan statistical areas that combine to create a CSA retain separate identities within the larger CSA.
___
Populations of some of the largest U.S. metropolitan areas by Ranking July 1, 2017
Combined Statistical Area
| New York-Newark, NY-NJ-CT-PA CSA | 23,876,155 |
| Los Angeles-Long Beach, CA CSA | 18,788,800 |
| Chicago-Naperville, IL-IN-WI CSA | 9,901,711 |
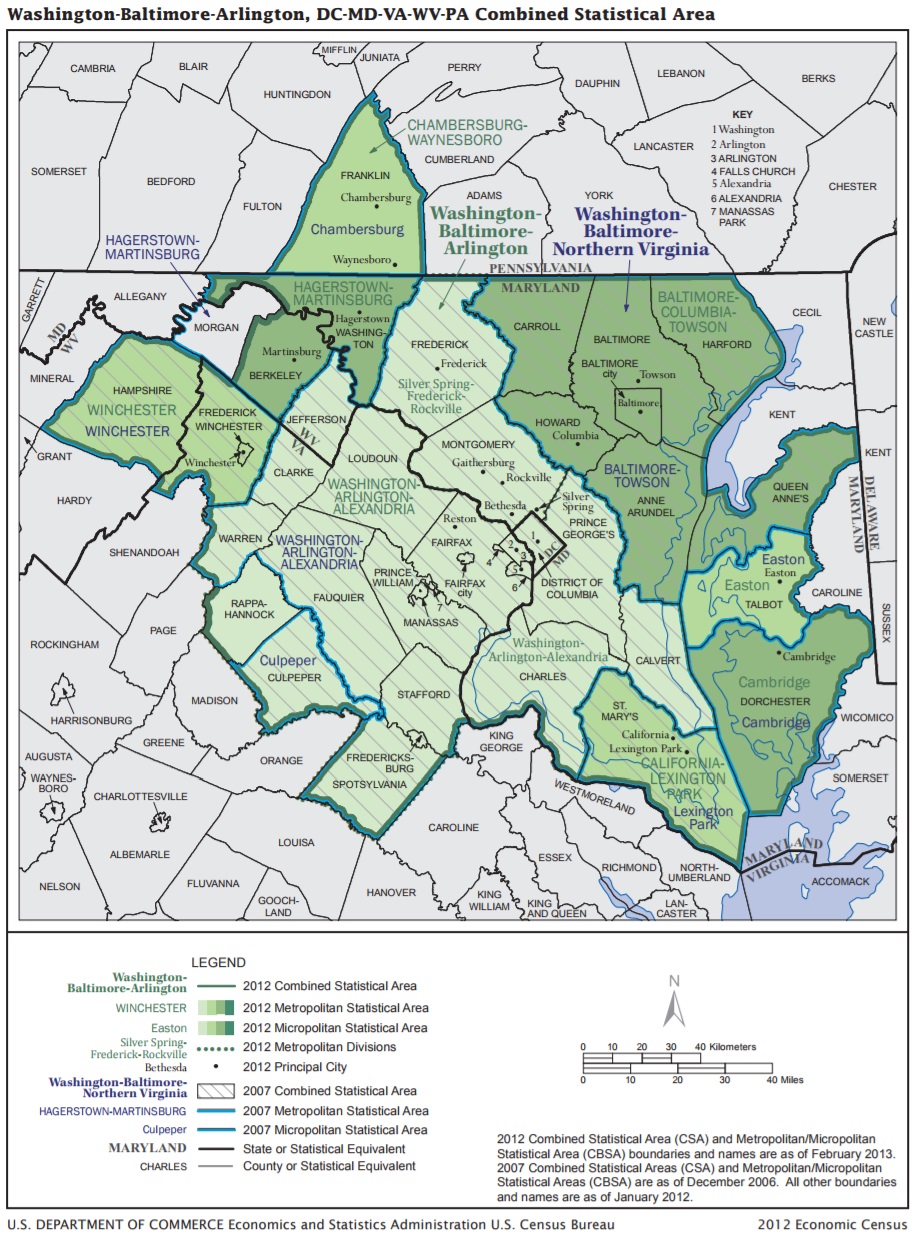
| Washington-Baltimore-Arlington, DC-MD-VA-WV-PA CSA | 9,764,315 |
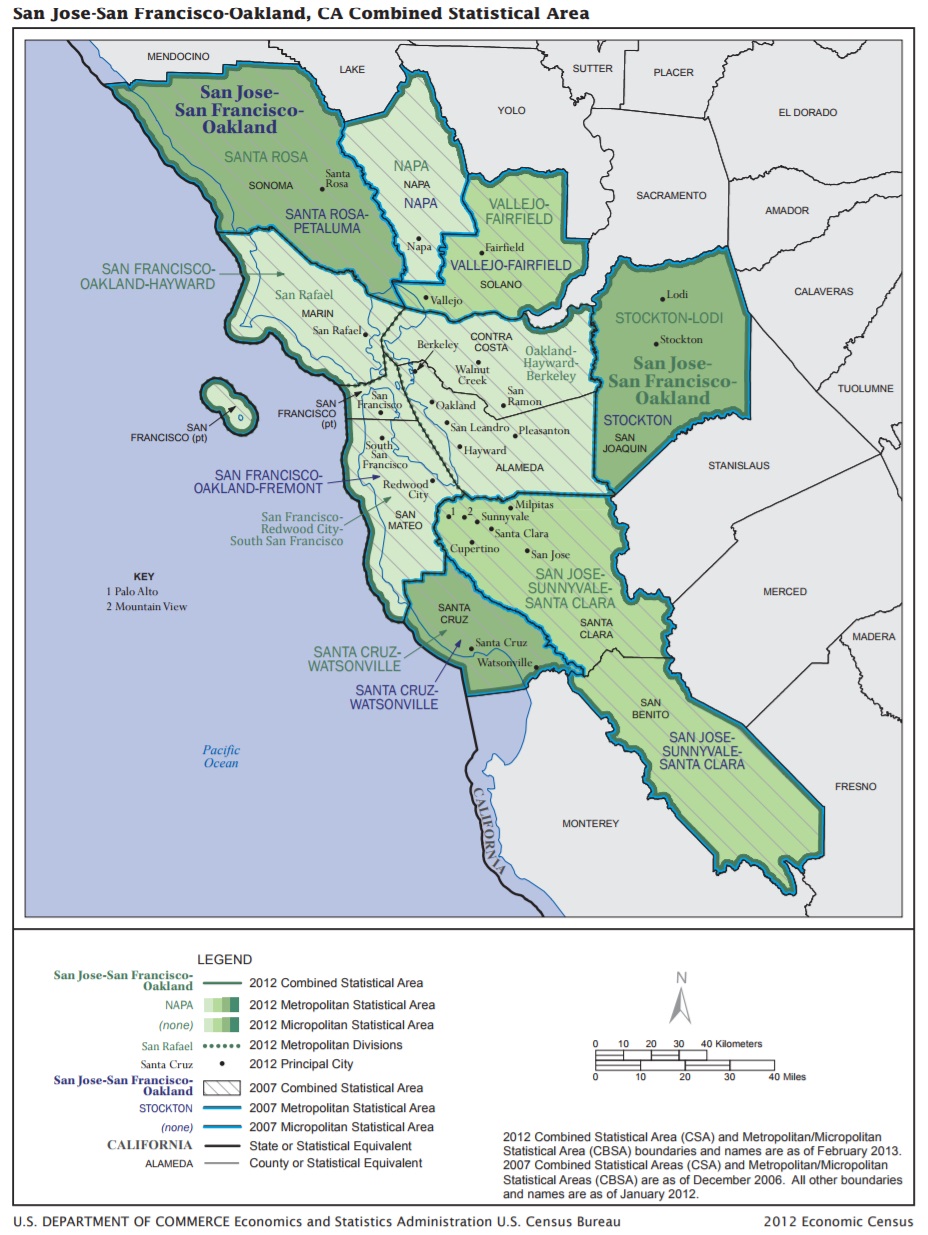
| San Jose-San Francisco-Oakland, CA CSA | 8,837,789 |
| Boston-Worcester-Providence, MA-RI-NH-CT CSA | 8,233,270 |
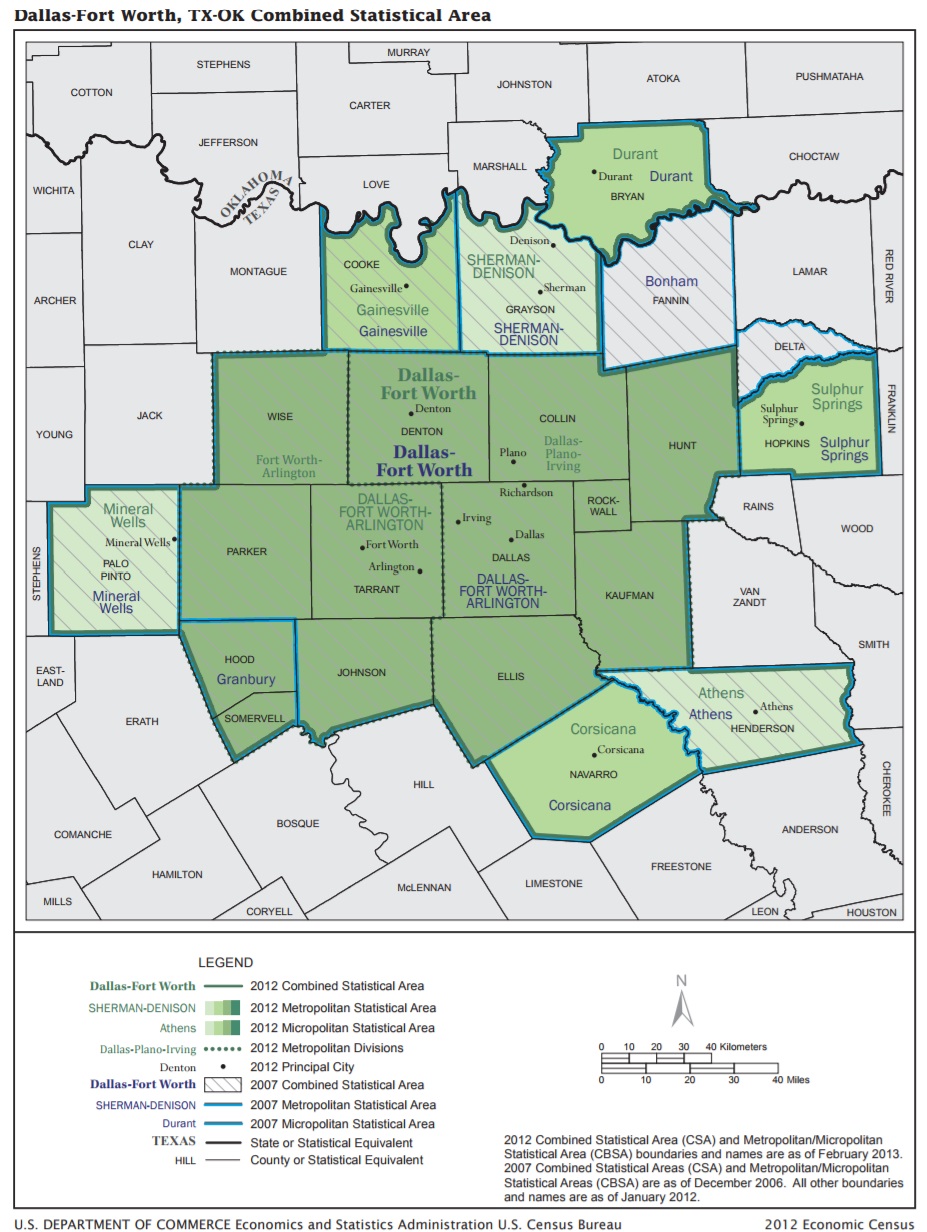
| Dallas-Fort Worth, TX-OK CSA | 7,846,293 |
| Philadelphia-Reading-Camden, PA-NJ-DE-MD CSA | 7,206,807 |
| Houston-The Woodlands, TX CSA | 7,093,190 |
| Miami-Fort Lauderdale-Port St. Lucie, FL CSA | 6,828,241 |
| Atlanta–Athens-Clarke County–Sandy Springs, GA CSA | 6,555,956 |
| Detroit-Warren-Ann Arbor, MI CSA | 5,336,286 |
| Seattle-Tacoma, WA CSA | 4,764,736 |
| Phoenix-Mesa-Scottsdale, AZ Metro Area | 4,737,270 |
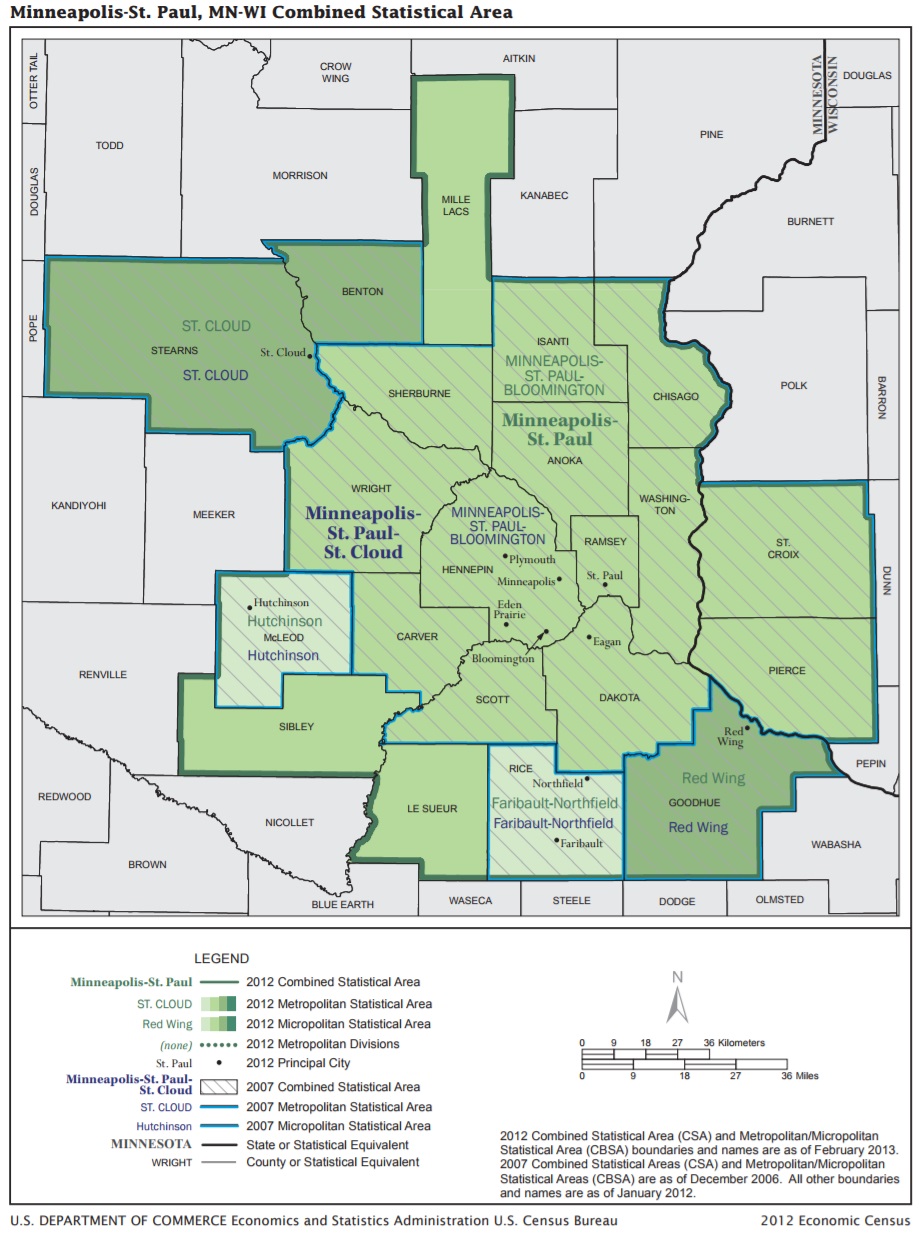
| Minneapolis-St. Paul, MN-WI CSA | 3,946,533 |
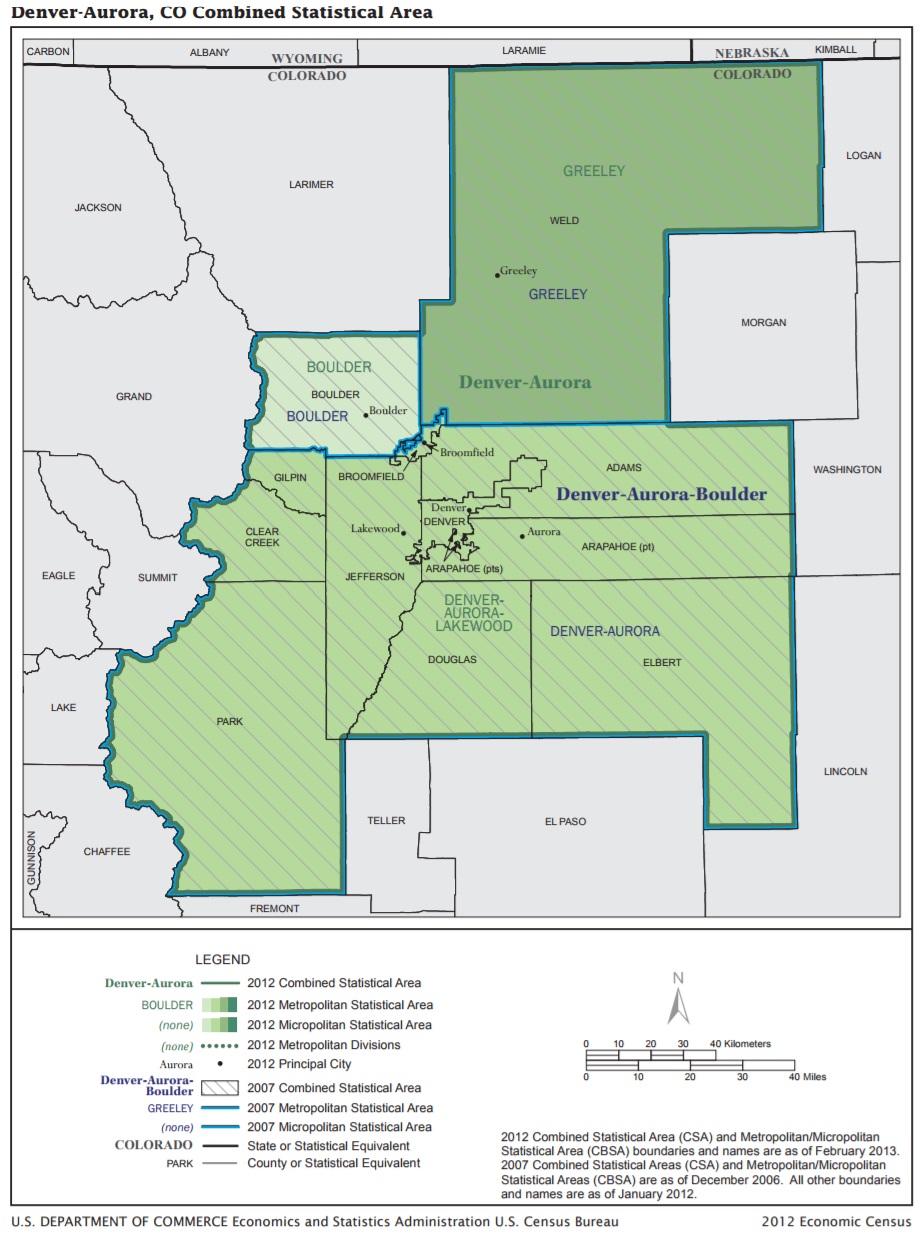
| Denver-Aurora, CO CSA | 3,515,374 |
| Cleveland-Akron-Canton, OH CSA | 3,485,691 |
| San Diego-Carlsbad, CA Metro Area | 3,337,685 |
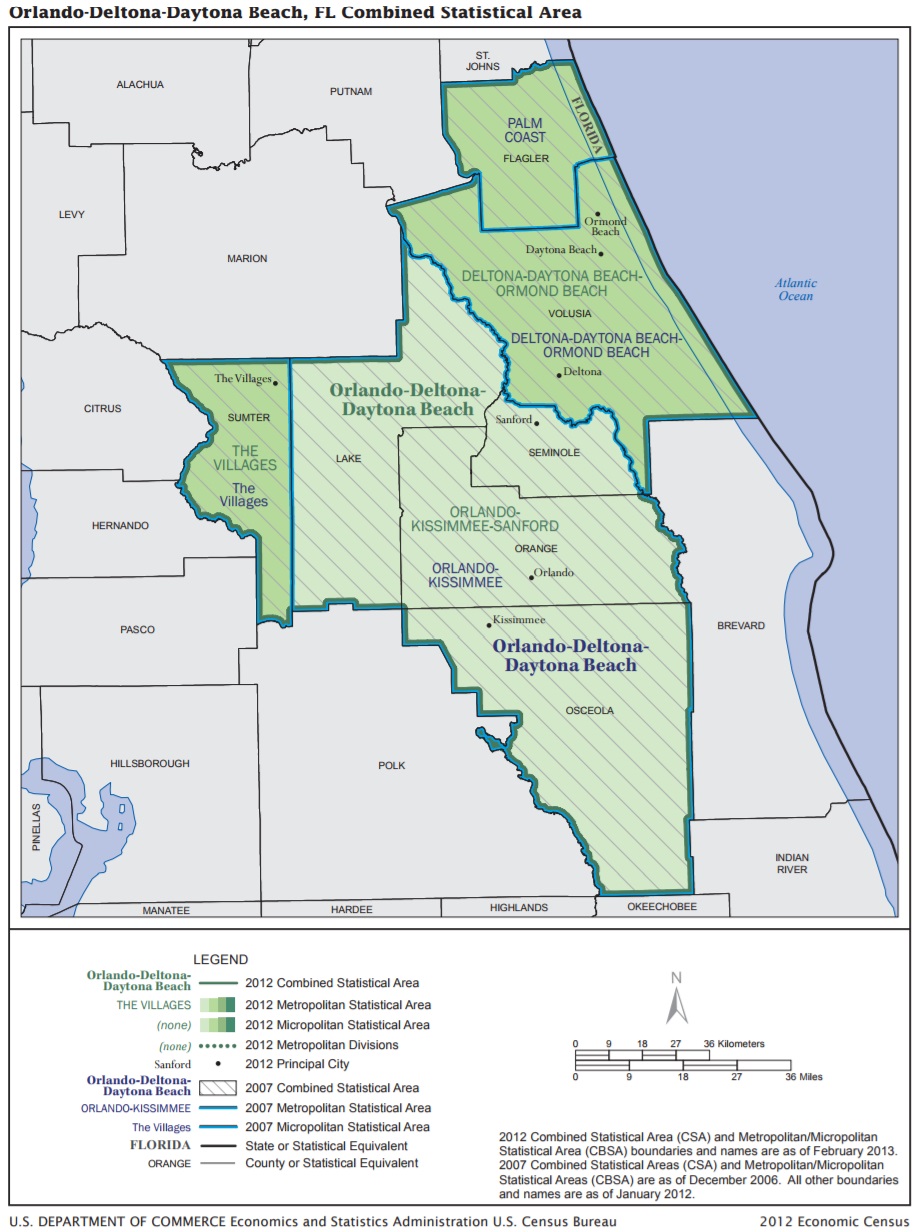
| Orlando-Deltona-Daytona Beach, FL CSA | 3,284,198 |
| Portland-Vancouver-Salem, OR-WA CSA | 3,201,058 |
| Tampa-St. Petersburg-Clearwater, FL Metro Area | 3,091,399 |
| St. Louis-St. Charles-Farmington, MO-IL CSA | 2,911,945 |
| Charlotte-Concord, NC-SC CSA | 2,684,121 |
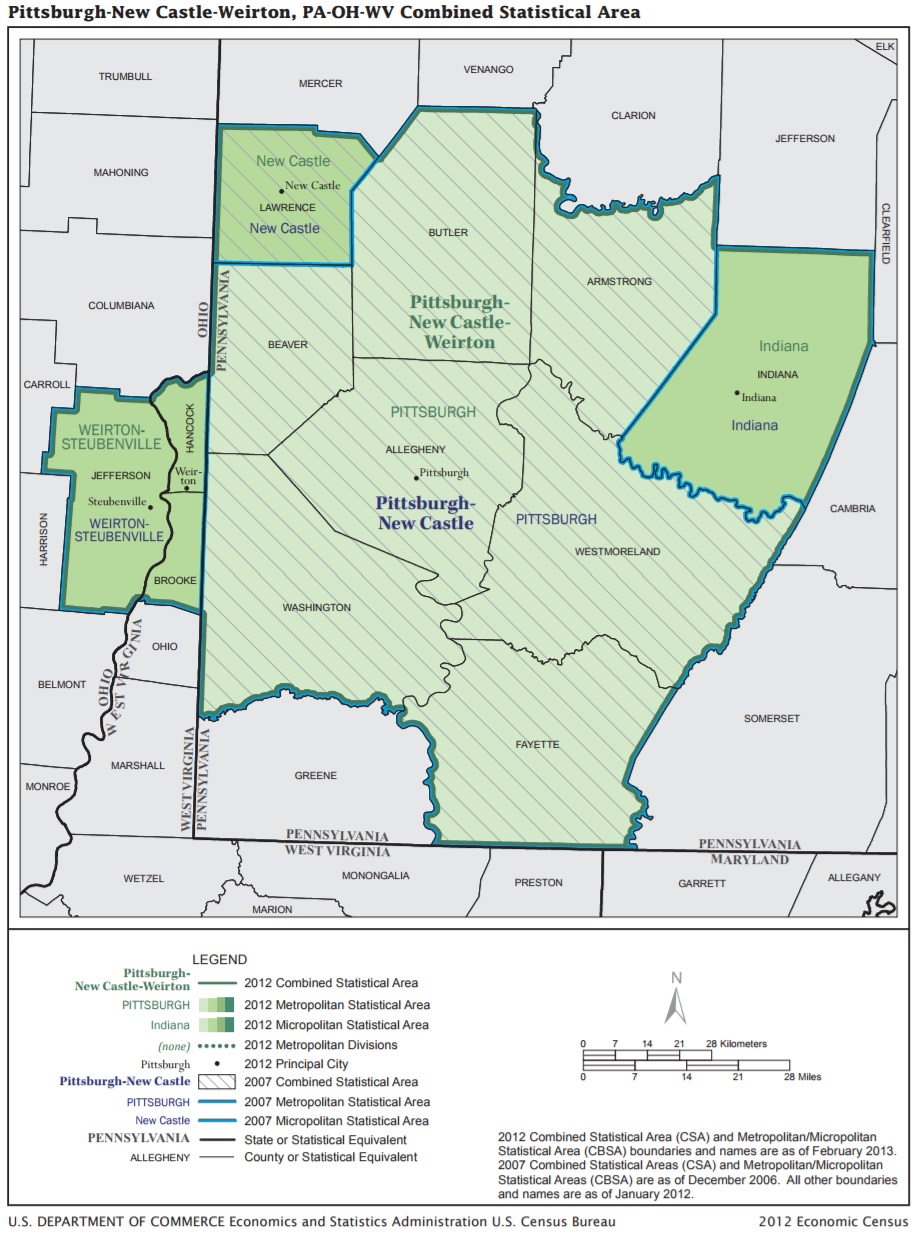
| Pittsburgh-New Castle-Weirton, PA-OH-WV CSA | 2,623,639 |
| Sacramento-Roseville, CA CSA | 2,598,377 |
| Salt Lake City-Provo-Orem, UT CSA | 2,559,350 |
| Columbus-Marion-Zanesville, OH CSA | 2,481,585 |
| San Antonio-New Braunfels, TX Metro Area | 2,473,974 |
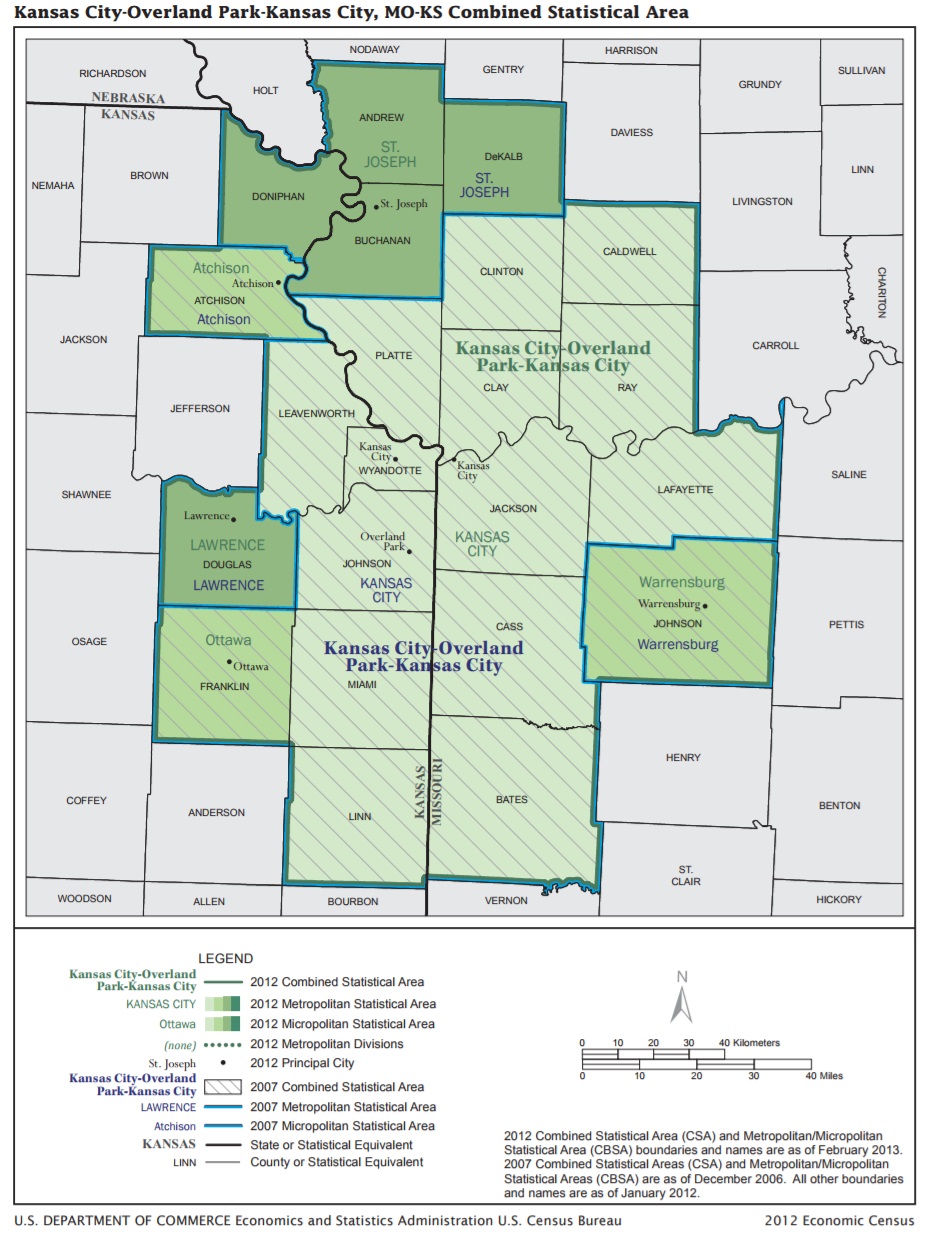
| Kansas City-Overland Park-Kansas City, MO-KS CSA | 2,472,602 |
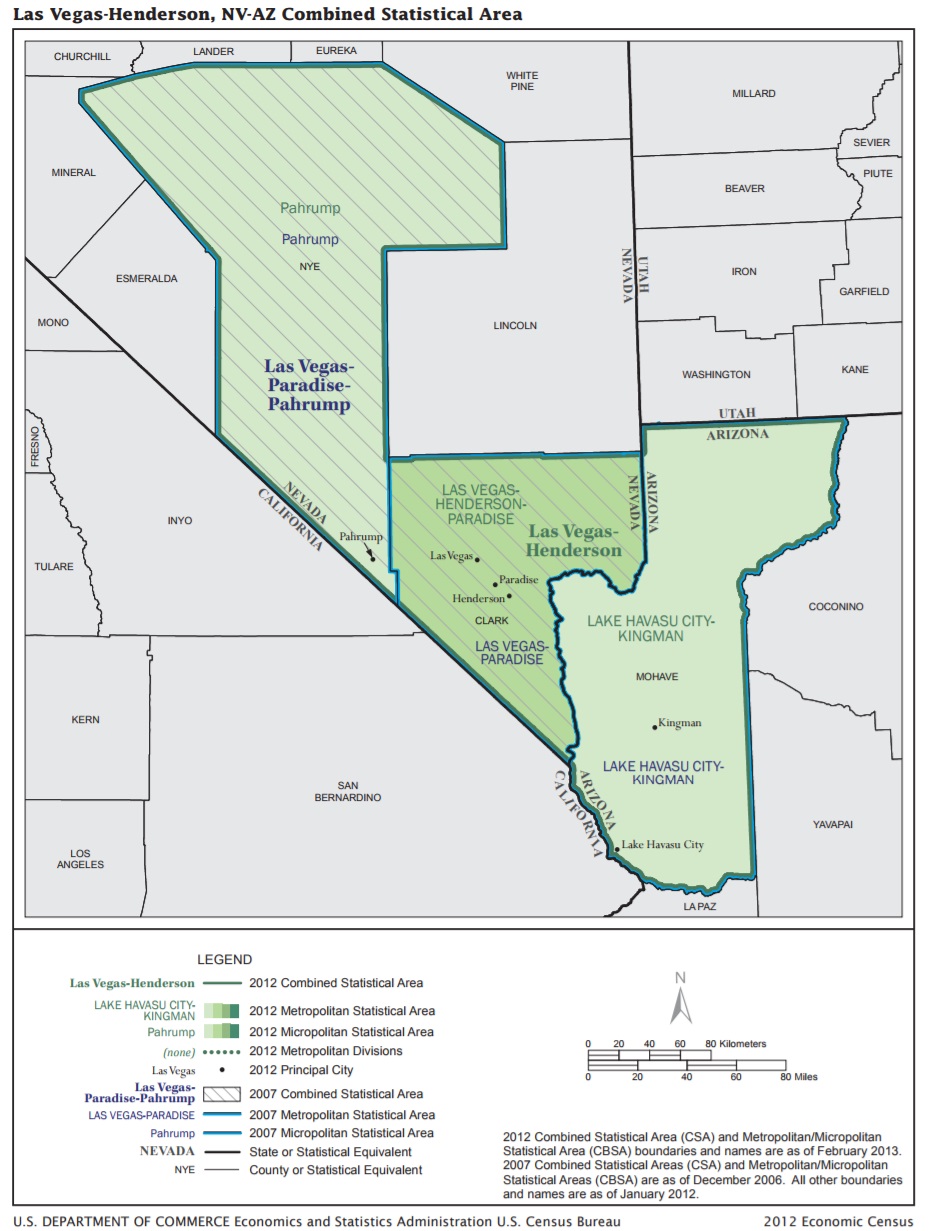
| Las Vegas-Henderson, NV-AZ CSA | 2,455,481 |
| Indianapolis-Carmel-Muncie, IN CSA | 2,411,086 |
| Cincinnati-Wilmington-Maysville, OH-KY-IN CSA | 2,238,265 |
| Raleigh-Durham-Chapel Hill, NC CSA | 2,199,459 |
| Austin-Round Rock, TX Metro Area | 2,115,827 |
| Milwaukee-Racine-Waukesha, WI CSA | 2,048,007 |
| Nashville-Davidson–Murfreesboro, TN CSA | 2,027,489 |
| Virginia Beach-Norfolk, VA-NC CSA | 1,829,195 |
| Greensboro–Winston-Salem–High Point, NC CSA | 1,663,532 |
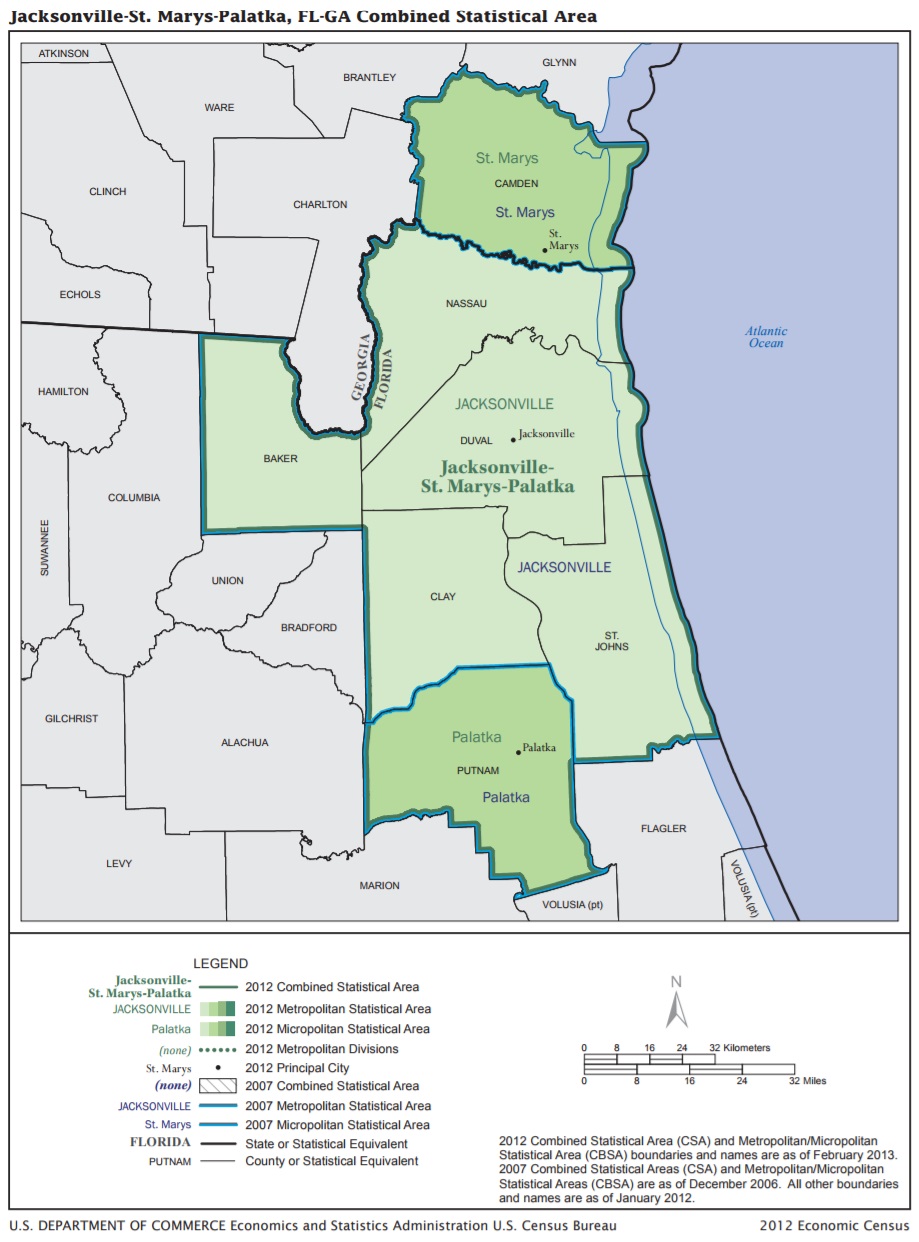
| Jacksonville-St. Marys-Palatka, FL-GA CSA | 1,631,488 |
| Louisville/Jefferson County–Elizabethtown–Madison, KY-IN CSA | 1,522,112 |
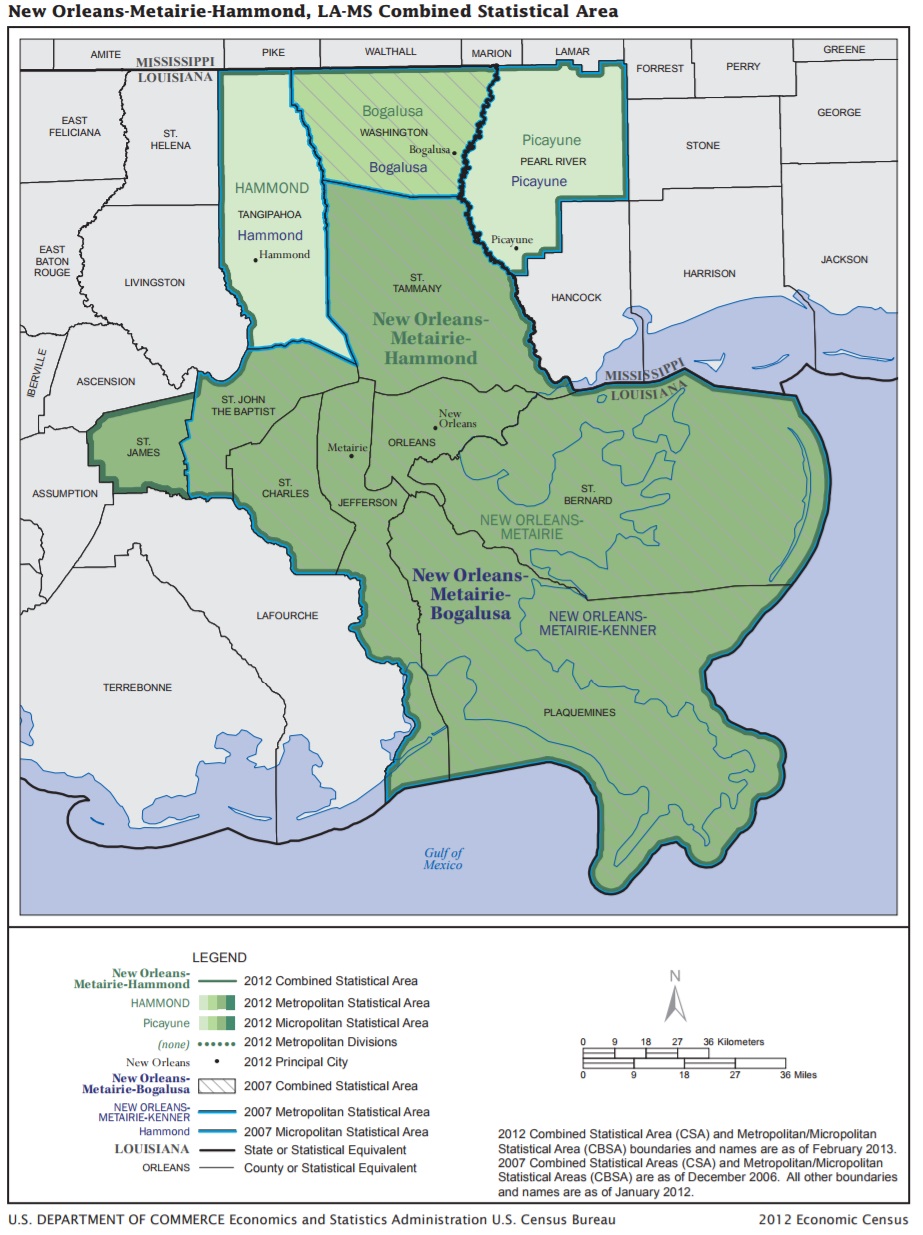
| New Orleans-Metairie-Hammond, LA-MS CSA | 1,510,162 |
| Hartford-West Hartford, CT CSA | 1,479,292 |
| Greenville-Spartanburg-Anderson, SC CSA | 1,459,766 |
| Grand Rapids-Wyoming-Muskegon, MI CSA | 1,456,935 |
| Oklahoma City-Shawnee, OK CSA | 1,455,963 |
| Memphis-Forrest City, TN-MS-AR CSA | 1,374,190 |
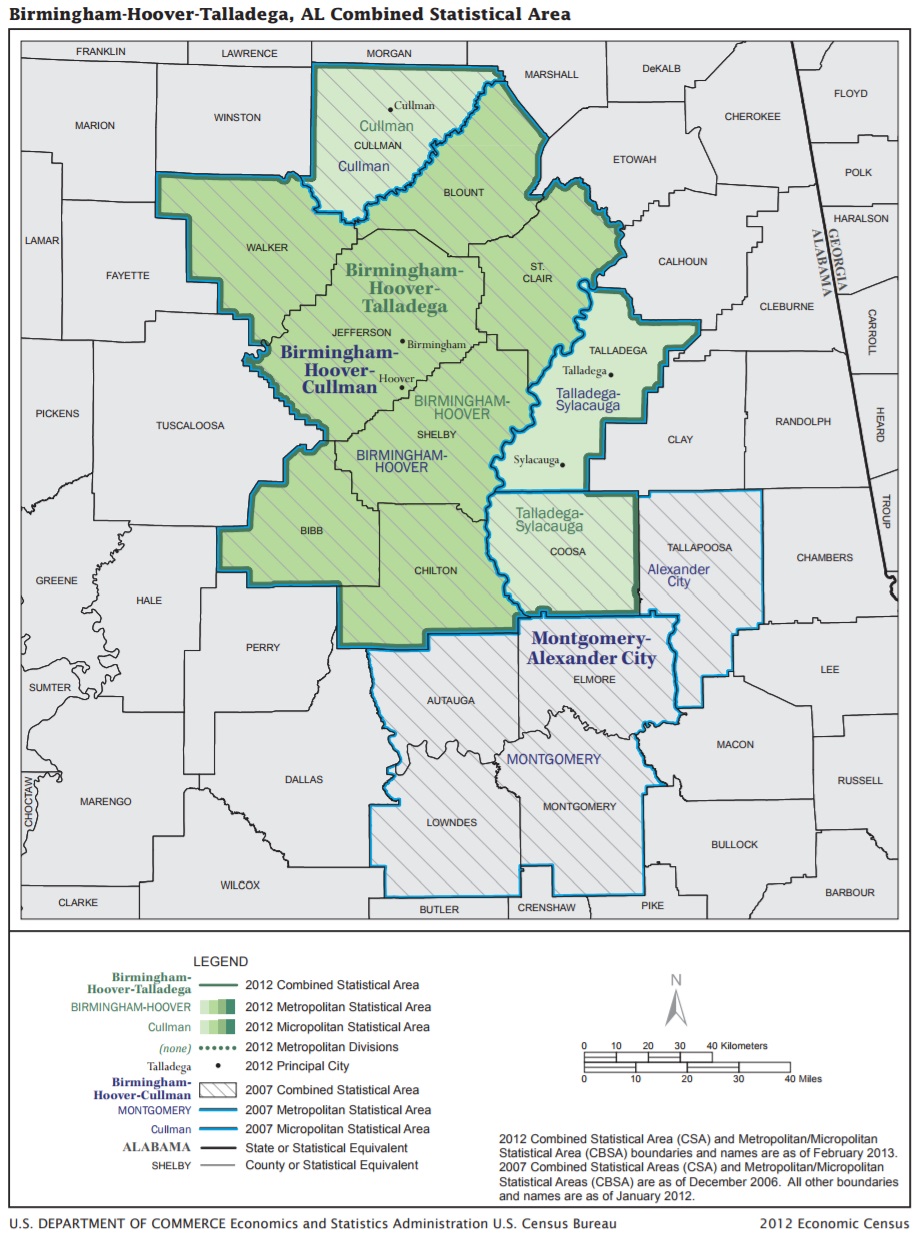
| Birmingham-Hoover-Talladega, AL CSA | 1,364,062 |
| Richmond, VA MSA | 1,294,204 |
| Harrisburg-York-Lebanon, PA CSA | 1,260,071 |
| Buffalo-Cheektowaga, NY CSA | 1,214,204 |
| Albany-Schenectady, NY CSA | 1,176,079 |
| Albuquerque-Santa Fe-Las Vegas, NM CSA | 1,171,974 |
| Rochester-Batavia-Seneca Falls, NY CSA | 1,170,402 |
| Tulsa-Muskogee-Bartlesville, OK CSA | 1,160,612 |
| Fresno-Madera, CA CSA | 1,146,145 |
| Knoxville-Morristown-Sevierville, TN CSA | 1,128,379 |
| Cape Coral-Fort Myers-Naples, FL CSA | 1,112,104 |
| Dayton-Springfield-Sidney, OH CSA | 1,077,108 |
| Tucson-Nogales, AZ CSA | 1,068,981 |
| El Paso-Las Cruces, TX-NM CSA | 1,060,397 |
| North Port-Sarasota, FL CSA | 1,023,585 |
| Omaha-Council Bluffs-Fremont, NE-IA CSA | 970,023 |
| Chattanooga-Cleveland-Dalton, TN-GA-AL CSA | 960,782 |
| Columbia-Orangeburg-Newberry, SC CSA | 950,997 |
| McAllen-Edinburg, TX CSA | 925,115 |
| Little Rock-North Little Rock, AR CSA | 908,323 |
| Madison-Janesville-Beloit, WI CSA | 880,520 |
| Modesto-Merced, CA CSA | 820,572 |
| Des Moines-Ames-West Des Moines, IA CSA | 806,863 |
| Boise City-Mountain Home-Ontario, ID-OR CSA | 790,363 |
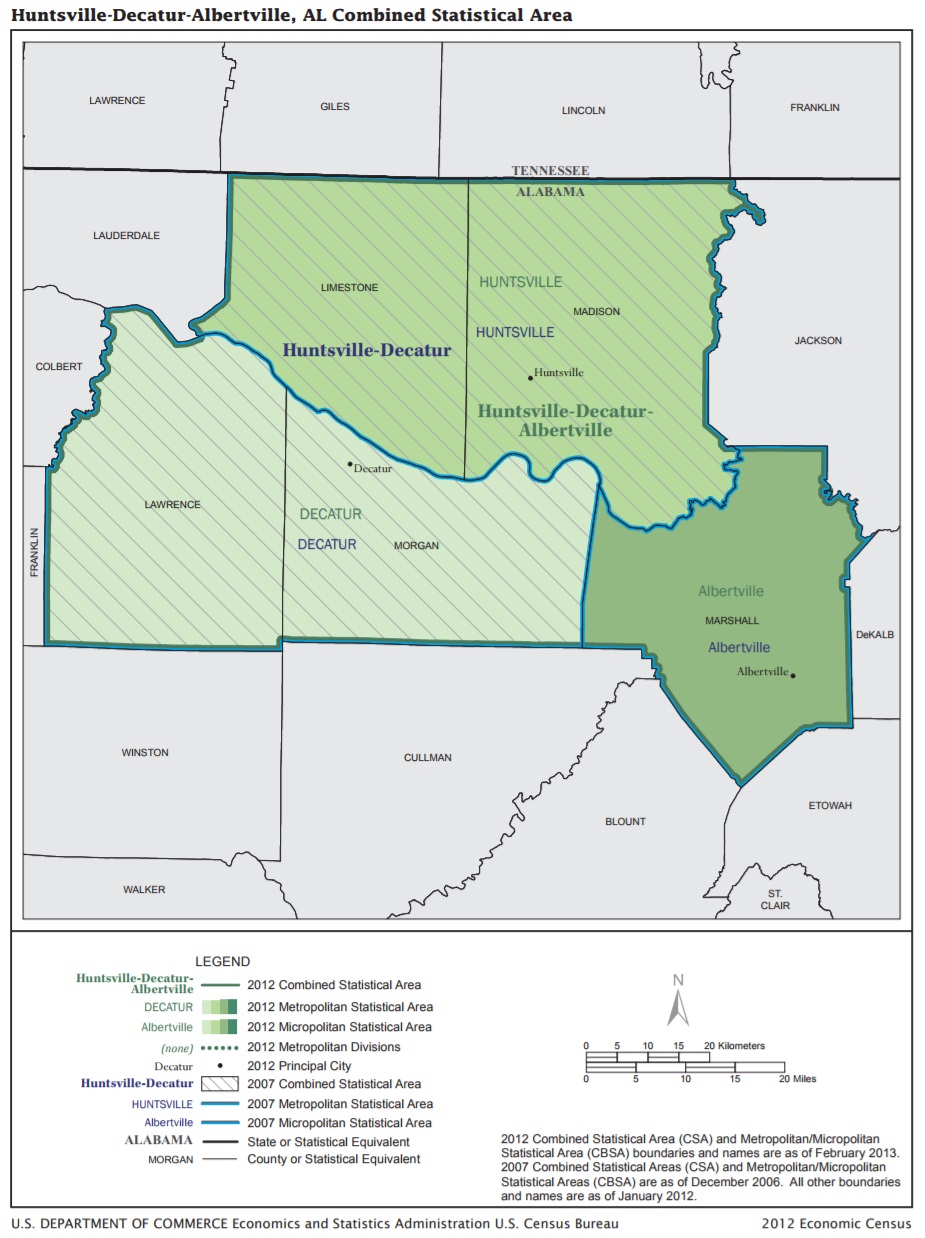
| Huntsville-Decatur-Albertville, AL CSA | 774,480 |
| Lexington-Fayette–Richmond–Frankfort, KY CSA | 740,364 |
| Syracuse-Auburn, NY CSA | 732,444 |
| South Bend-Elkhart-Mishawaka, IN-MI CSA | 727,604 |
| Spokane-Spokane Valley-Coeur d’Alene, WA-ID CSA | 721,873 |
| Springfield-Greenfield Town, MA CSA | 702,354 |
| Wichita-Arkansas City-Winfield, KS CSA | 680,989 |
| Charleston-Huntington-Ashland, WV-OH-KY CSA | 679,734 |
| Jackson-Vicksburg-Brookhaven, MS CSA | 668,780 |
| Youngstown-Warren, OH-PA CSA | 645,003 |
| Toledo-Port Clinton, OH CSA | 644,325 |
| Portland-Lewiston-South Portland, ME CSA | 639,734 |
| Fort Wayne-Huntington-Auburn, IN CSA | 631,217 |
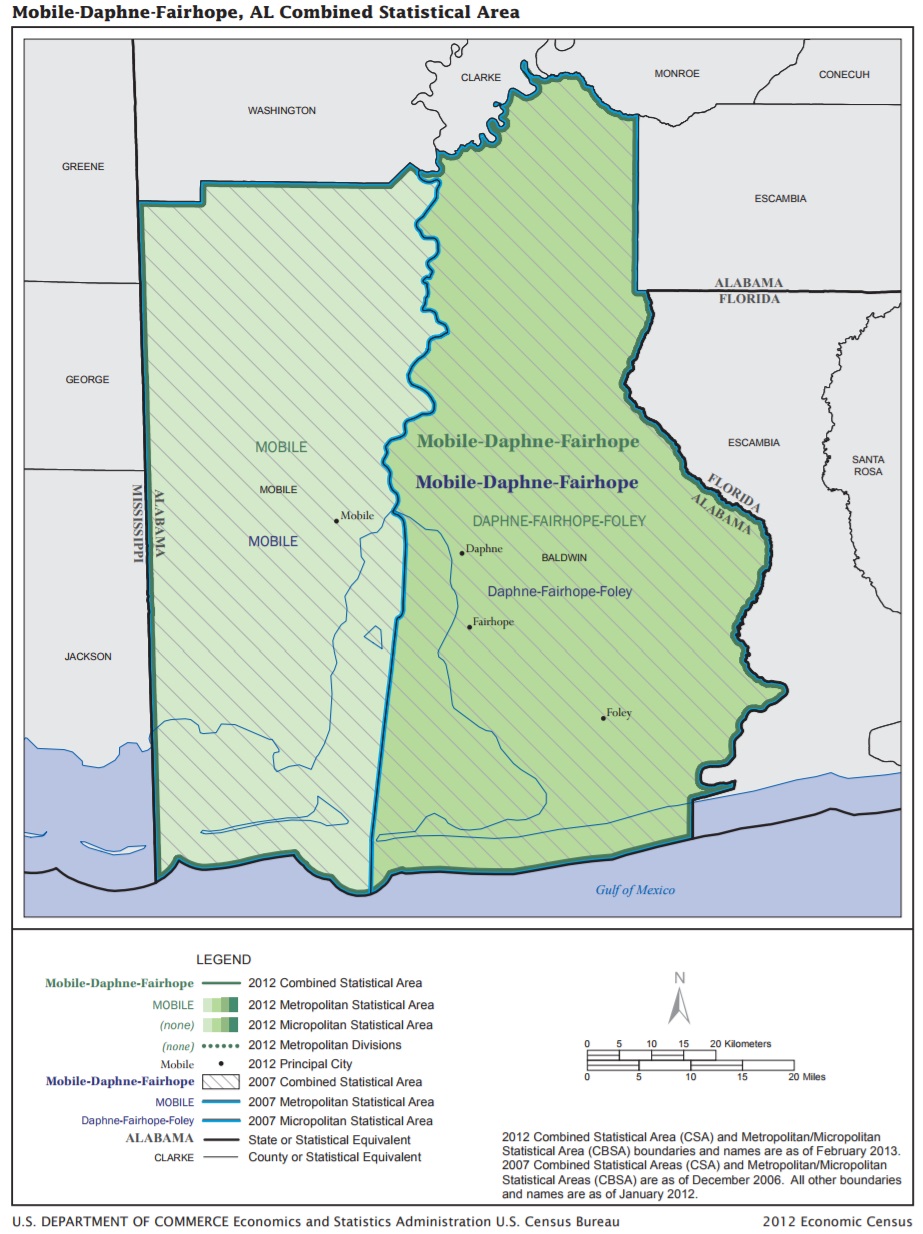
| Mobile-Daphne-Fairhope, AL CSA | 626,583 |
| Lafayette-Opelousas-Morgan City, LA CSA | 626,028 |
| Reno-Carson City-Fernley, NV CSA | 621,769 |
| Visalia-Porterville-Hanford, CA CSA | 614,594 |
| Augusta-Richmond County, GA-SC Metro Area | 600,151 |
| Fayetteville-Lumberton-Laurinburg, NC CSA | 554,361 |
| Springfield-Branson, MO CSA | 549,423 |
| Lansing-East Lansing-Owosso, MI CSA | 546,102 |
| Savannah-Hinesville-Statesboro, GA CSA | 544,092 |
| Kalamazoo-Battle Creek-Portage, MI CSA | 533,413 |
| Corpus Christi-Kingsville-Alice, TX CSA | 526,384 |
| Myrtle Beach-Conway, SC-NC CSA | 525,772 |
| Pensacola-Ferry Pass, FL-AL CSA | 525,231 |
| Johnson City-Kingsport-Bristol, TN-VA CSA | 508,712 |
| Columbus-Auburn-Opelika, GA-AL CSA | 499,128 |
| Asheville-Brevard, NC CSA | 490,101 |
| Davenport-Moline, IA-IL CSA | 472,153 |
| Brownsville-Harlingen-Raymondville, TX CSA | 445,309 |
| Cedar Rapids-Iowa City, IA CSA | 441,784 |
| Rockford-Freeport-Rochelle, IL CSA | 434,408 |
| Macon-Bibb County–Warner Robins, GA CSA | 420,693 |
| Hickory-Lenoir, NC CSA | 411,693 |
| Tallahassee-Bainbridge, FL-GA CSA | 409,343 |
| Peoria-Canton, IL CSA | 407,537 |
| Appleton-Oshkosh-Neenah, WI CSA | 406,540 |
| Gulfport-Biloxi-Pascagoula, MS Metro Area | 394,232/td> |
| Saginaw-Midland-Bay City, MI CSA | 379,584 |
| Green Bay-Shawano, WI CSA | 365,600 |
| Erie-Meadville, PA CSA | 360,700 |
| Gainesville-Lake City, FL CSA | 354,299 |
| Lincoln-Beatrice, NE CSA | 353,120 |
| Lubbock-Levelland, TX CSA | 340,071 |
| Midland-Odessa, TX CSA | 327,762 |
| Springfield-Jacksonville-Lincoln, IL CSA | 309,844 |
| Wausau-Stevens Point-Wisconsin Rapids, WI CSA | 307,170 |
| Medford-Grants Pass, OR CSA | 303,831 |
| Rocky Mount-Wilson-Roanoke Rapids, NC CSA | 299,581 |
| Wilmington, NC Metro Area | 288,156 |
| Amarillo-Borger, TX CSA | 286,300 |
| Longview-Marshall, TX CSA | 284,142 |
| Tyler-Jacksonville, TX CSA | 279,967 |
| Fargo-Wahpeton, ND-MN CSA | 264,031 |
| Bloomsburg-Berwick-Sunbury, PA CSA | 261,629 |
| Rochester-Austin, MN CSA | 257,846 |
| Harrisonburg-Staunton-Waynesboro, VA CSA | 256,441 |
| Monroe-Ruston-Bastrop, LA CSA | 251,830 |
| Lafayette-West Lafayette-Frankfort, IN CSA | 251,556 |
| Dothan-Enterprise-Ozark, AL CSA | 249,014 |
| Redding-Red Bluff, CA CSA | 243,847 |
| Idaho Falls-Rexburg-Blackfoot, ID CSA | 243,805 |
| State College-DuBois, PA CSA | 242,345 |
| Lake Charles-Jennings, LA CSA | 240,834 |
| Columbia-Moberly-Mexico, MO CSA | 228,857 |
| Bowling Green-Glasgow, KY CSA | 228,743 |
| Greenville-Washington, NC CSA | 226,130 |
| Bloomington-Pontiac, IL CSA | 224,750 |
| Lima-Van Wert-Celina, OH CSA | 218,066 |
| Mansfield-Ashland-Bucyrus, OH CSA | 215,963 |
| Pueblo-Cañon City, CO CSA | 214,034 |
| Bloomington-Bedford, IN CSA | 213,491 |
| Eau Claire-Menomonie, WI CSA | 212,177 |
| Bend-Redmond-Prineville, OR CSA | 209,998 |
| Joplin-Miami, MO-OK CSA | 209,819 |
| Johnstown-Somerset, PA CSA | 207,555 |
| Morgantown-Fairmont, WV CSA | 195,046 |
| New Bern-Morehead City, NC CSA | 193,745 |
| Sioux City-Vermillion, IA-SD-NE CSA | 182,608 |
| Elmira-Corning, NY CSA | 181,838 |
| Jonesboro-Paragould, AR CSA | 176,322 |
| Rapid City-Spearfish, SD CSA | 172,279 |
| Williamsport-Lock Haven, PA CSA | 152,839 |
| Ithaca-Cortland, NY CSA | 152,588 |
| Parkersburg-Marietta-Vienna, WV-OH CSA | 151,316 |
| Jackson-Brownsville, TN CSA | 146,808 |
| Cape Girardeau-Sikeston, MO-IL CSA | 135,323 |
| Paducah-Mayfield, KY-IL CSA | 134,158 |
| Hot Springs-Malvern, AR CSA | 132,232 |
| Manhattan-Junction City, KS CSA | 131,935 |
| Edwards-Glenwood Springs, CO CSA | 131,780 |
| Findlay-Tiffin, OH CSA | 130,997 |
| Mankato-New Ulm-North Mankato, MN CSA | 126,133 |
| Rome-Summerville, GA CSA | 122,383 |
| Victoria-Port Lavaca, TX CSA | 121,390 |
| Kokomo-Peru, IN CSA | 118,208 |
| Quincy-Hannibal, IL-MO CSA | 115,059 |
| Moses Lake-Othello, WA CSA | 114,664 |
| Mount Pleasant-Alma, MI CSA | 112,081 |
| Dixon-Sterling, IL CSA | 90,524 |
| Richmond-Connersville, IN CSA | 89,394 |
| Pullman-Moscow, WA-ID CSA | 88,379 |
| DeRidder-Fort Polk South, LA CSA | 87,654 |
| Columbus-West Point, MS CSA | 78,826 |
| Martin-Union City, TN-KY CSA | 69,914 |
| Clovis-Portales, NM CSA | 68,659 |
| Cleveland-Indianola, MS CSA | 57,926 |
| Oskaloosa-Pella, IA CSA | 55,340 |
| Steamboat Springs-Craig, CO CSA | 38,351 |
__________________________
| 2017 Combined Statistical Area by name |
| Albany-Schenectady, NY CSA | 1,176,079 |
| Albuquerque-Santa Fe-Las Vegas, NM CSA | 1,171,974 |
| Amarillo-Borger, TX CSA | 286,300 |
| Appleton-Oshkosh-Neenah, WI CSA | 406,540 |
| Asheville-Brevard, NC CSA | 490,101 |
| Atlanta–Athens-Clarke County–Sandy Springs, GA CSA | 6,555,956 |
| Augusta-Richmond County, GA-SC Metro Area | 600,151 |
| Austin-Round Rock, TX Metro Area | 2,115,827 |
| Bend-Redmond-Prineville, OR CSA | 209,998 |
| Birmingham-Hoover-Talladega, AL CSA | 1,364,062 |
| Bloomington-Bedford, IN CSA | 213,491 |
| Bloomington-Pontiac, IL CSA | 224,750 |
| Bloomsburg-Berwick-Sunbury, PA CSA | 261,629 |
| Boise City-Mountain Home-Ontario, ID-OR CSA | 790,363 |
| Boston-Worcester-Providence, MA-RI-NH-CT CSA | 8,233,270 |
| Bowling Green-Glasgow, KY CSA | 228,743 |
| Brownsville-Harlingen-Raymondville, TX CSA | 445,309 |
| Buffalo-Cheektowaga, NY CSA | 1,214,204 |
| Cape Coral-Fort Myers-Naples, FL CSA | 1,112,104 |
| Cape Girardeau-Sikeston, MO-IL CSA | 135,323 |
| Cedar Rapids-Iowa City, IA CSA | 441,784 |
| Charleston-Huntington-Ashland, WV-OH-KY CSA | 679,734 |
| Charlotte-Concord, NC-SC CSA | 2,684,121 |
| Chattanooga-Cleveland-Dalton, TN-GA-AL CSA | 960,782 |
| Chicago-Naperville, IL-IN-WI CSA | 9,901,711 |
| Cincinnati-Wilmington-Maysville, OH-KY-IN CSA | 2,238,265 |
| Cleveland-Akron-Canton, OH CSA | 3,485,691 |
| Cleveland-Indianola, MS CSA | 57,926 |
| Clovis-Portales, NM CSA | 68,659 |
| Columbia-Moberly-Mexico, MO CSA | 228,857 |
| Columbia-Orangeburg-Newberry, SC CSA | 950,997 |
| Columbus-Auburn-Opelika, GA-AL CSA | 499,128 |
| Columbus-Marion-Zanesville, OH CSA | 2,481,585 |
| Columbus-West Point, MS CSA | 78,826 |
| Corpus Christi-Kingsville-Alice, TX CSA | 526,384 |
| Dallas-Fort Worth, TX-OK CSA | 7,846,293 |
| Davenport-Moline, IA-IL CSA | 472,153 |
| Dayton-Springfield-Sidney, OH CSA | 1,077,108 |
| Denver-Aurora, CO CSA | 3,515,374 |
| DeRidder-Fort Polk South, LA CSA | 87,654 |
| Des Moines-Ames-West Des Moines, IA CSA | 806,863 |
| Detroit-Warren-Ann Arbor, MI CSA | 5,336,286 |
| Dixon-Sterling, IL CSA | 90,524 |
| Dothan-Enterprise-Ozark, AL CSA | 249,014 |
| Eau Claire-Menomonie, WI CSA | 212,177 |
| Edwards-Glenwood Springs, CO CSA | 131,780 |
| Elmira-Corning, NY CSA | 181,838 |
| El Paso-Las Cruces, TX-NM CSA | 1,060,397 |
| Erie-Meadville, PA CSA | 360,700 |
| Fargo-Wahpeton, ND-MN CSA | 264,031 |
| Fayetteville-Lumberton-Laurinburg, NC CSA | 554,361 |
| Findlay-Tiffin, OH CSA | 130,997 |
| Fort Wayne-Huntington-Auburn, IN CSA | 631,217 |
| Fresno-Madera, CA CSA | 1,146,145 |
| Gainesville-Lake City, FL CSA | 354,299 |
| Grand Rapids-Wyoming-Muskegon, MI CSA | 1,456,935 |
| Green Bay-Shawano, WI CSA | 365,600 |
| Greensboro–Winston-Salem–High Point, NC CSA | 1,663,532 |
| Greenville-Spartanburg-Anderson, SC CSA | 1,459,766 |
| Greenville-Washington, NC CSA | 226,130 |
| Gulfport-Biloxi-Pascagoula, MS Metro Area | 394,232/td> |
| Harrisburg-York-Lebanon, PA CSA | 1,260,071 |
| Harrisonburg-Staunton-Waynesboro, VA CSA | 256,441 |
| Hartford-West Hartford, CT CSA | 1,479,292 |
| Hickory-Lenoir, NC CSA | 411,693 |
| Hot Springs-Malvern, AR CSA | 132,232 |
| Houston-The Woodlands, TX CSA | 7,093,190 |
| Huntsville-Decatur-Albertville, AL CSA | 774,480 |
| Idaho Falls-Rexburg-Blackfoot, ID CSA | 243,805 |
| Indianapolis-Carmel-Muncie, IN CSA | 2,411,086 |
| Ithaca-Cortland, NY CSA | 152,588 |
| Jackson-Brownsville, TN CSA | 146,808 |
| Jackson-Vicksburg-Brookhaven, MS CSA | 668,780 |
| Jacksonville-St. Marys-Palatka, FL-GA CSA | 1,631,488 |
| Johnson City-Kingsport-Bristol, TN-VA CSA | 508,712 |
| Johnstown-Somerset, PA CSA | 207,555 |
| Jonesboro-Paragould, AR CSA | 176,322 |
| Joplin-Miami, MO-OK CSA | 209,819 |
| Kalamazoo-Battle Creek-Portage, MI CSA | 533,413 |
| Kansas City-Overland Park-Kansas City, MO-KS CSA | 2,472,602 |
| Knoxville-Morristown-Sevierville, TN CSA | 1,128,379 |
| Kokomo-Peru, IN CSA | 118,208 |
| Lafayette-Opelousas-Morgan City, LA CSA | 626,028 |
| Lafayette-West Lafayette-Frankfort, IN CSA | 251,556 |
| Lake Charles-Jennings, LA CSA | 240,834 |
| Lansing-East Lansing-Owosso, MI CSA | 546,102 |
| Las Vegas-Henderson, NV-AZ CSA | 2,455,481 |
| Lexington-Fayette–Richmond–Frankfort, KY CSA | 740,364 |
| Lima-Van Wert-Celina, OH CSA | 218,066 |
| Lincoln-Beatrice, NE CSA | 353,120 |
| Little Rock-North Little Rock, AR CSA | 908,323 |
| Longview-Marshall, TX CSA | 284,142 |
| Los Angeles-Long Beach, CA CSA | 18,788,800 |
| Louisville/Jefferson County–Elizabethtown–Madison, KY-IN CSA | 1,522,112 |
| Lubbock-Levelland, TX CSA | 340,071 |
| Macon-Bibb County–Warner Robins, GA CSA | 420,693 |
| Madison-Janesville-Beloit, WI CSA | 880,520 |
| Manhattan-Junction City, KS CSA | 131,935 |
| Mankato-New Ulm-North Mankato, MN CSA | 126,133 |
| Mansfield-Ashland-Bucyrus, OH CSA | 215,963 |
| Martin-Union City, TN-KY CSA | 69,914 |
| McAllen-Edinburg, TX CSA | 925,115 |
| Medford-Grants Pass, OR CSA | 303,831 |
| Memphis-Forrest City, TN-MS-AR CSA | 1,374,190 |
| Miami-Fort Lauderdale-Port St. Lucie, FL CSA | 6,828,241 |
| Midland-Odessa, TX CSA | 327,762 |
| Milwaukee-Racine-Waukesha, WI CSA | 2,048,007 |
| Minneapolis-St. Paul, MN-WI CSA | 3,946,533 |
| Mobile-Daphne-Fairhope, AL CSA | 626,583 |
| Modesto-Merced, CA CSA | 820,572 |
| Monroe-Ruston-Bastrop, LA CSA | 251,830 |
| Morgantown-Fairmont, WV CSA | 195,046 |
| Moses Lake-Othello, WA CSA | 114,664 |
| Mount Pleasant-Alma, MI CSA | 112,081 |
| Myrtle Beach-Conway, SC-NC CSA | 525,772 |
| Nashville-Davidson–Murfreesboro, TN CSA | 2,027,489 |
| New Bern-Morehead City, NC CSA | 193,745 |
| New Orleans-Metairie-Hammond, LA-MS CSA | 1,510,162 |
| New York-Newark, NY-NJ-CT-PA CSA | 23,876,155 |
| North Port-Sarasota, FL CSA | 1,023,585 |
| Oklahoma City-Shawnee, OK CSA | 1,455,963 |
| Omaha-Council Bluffs-Fremont, NE-IA CSA | 970,023 |
| Orlando-Deltona-Daytona Beach, FL CSA | 3,284,198 |
| Oskaloosa-Pella, IA CSA | 55,340 |
| Paducah-Mayfield, KY-IL CSA | 134,158 |
| Parkersburg-Marietta-Vienna, WV-OH CSA | 151,316 |
| Pensacola-Ferry Pass, FL-AL CSA | 525,231 |
| Peoria-Canton, IL CSA | 407,537 |
| Phoenix-Mesa-Scottsdale, AZ Metro Area | 4,737,270 |
| Philadelphia-Reading-Camden, PA-NJ-DE-MD CSA | 7,206,807 |
| Pittsburgh-New Castle-Weirton, PA-OH-WV CSA | 2,623,639 |
| Portland-Lewiston-South Portland, ME CSA | 639,734 |
| Portland-Vancouver-Salem, OR-WA CSA | 3,201,058 |
| Pueblo-Cañon City, CO CSA | 214,034 |
| Pullman-Moscow, WA-ID CSA | 88,379 |
| Quincy-Hannibal, IL-MO CSA | 115,059 |
| Raleigh-Durham-Chapel Hill, NC CSA | 2,199,459 |
| Rapid City-Spearfish, SD CSA | 172,279 |
| Redding-Red Bluff, CA CSA | 243,847 |
| Reno-Carson City-Fernley, NV CSA | 621,769 |
| Richmond-Connersville, IN CSA | 89,394 |
| Rochester-Austin, MN CSA | 257,846 |
| Rochester-Batavia-Seneca Falls, NY CSA | 1,170,402 |
| Rockford-Freeport-Rochelle, IL CSA | 434,408 |
| Rocky Mount-Wilson-Roanoke Rapids, NC CSA | 299,581 |
| Rome-Summerville, GA CSA | 122,383 |
| Sacramento-Roseville, CA CSA | 2,598,377 |
| Saginaw-Midland-Bay City, MI CSA | 379,584 |
| St. Louis-St. Charles-Farmington, MO-IL CSA | 2,911,945 |
| Salt Lake City-Provo-Orem, UT CSA | 2,559,350 |
| San Antonio-New Braunfels, TX Metro Area | 2,473,974 |
| San Diego-Carlsbad, CA Metro Area | 3,337,685 |
| San Jose-San Francisco-Oakland, CA CSA | 8,837,789 |
| Savannah-Hinesville-Statesboro, GA CSA | 544,092 |
| Seattle-Tacoma, WA CSA | 4,764,736 |
| Sioux City-Vermillion, IA-SD-NE CSA | 182,608 |
| South Bend-Elkhart-Mishawaka, IN-MI CSA | 727,604 |
| Spokane-Spokane Valley-Coeur d’Alene, WA-ID CSA | 721,873 |
| Springfield-Branson, MO CSA | 549,423 |
| Springfield-Greenfield Town, MA CSA | 702,354 |
| Springfield-Jacksonville-Lincoln, IL CSA | 309,844 |
| State College-DuBois, PA CSA | 242,345 |
| Steamboat Springs-Craig, CO CSA | 38,351 |
| Syracuse-Auburn, NY CSA | 732,444 |
| Tallahassee-Bainbridge, FL-GA CSA | 409,343 |
| Toledo-Port Clinton, OH CSA | 644,325 |
| Tucson-Nogales, AZ CSA | 1,068,981 |
| Tulsa-Muskogee-Bartlesville, OK CSA | 1,160,612 |
| Tyler-Jacksonville, TX CSA | 279,967 |
| Victoria-Port Lavaca, TX CSA | 121,390 |
| Virginia Beach-Norfolk, VA-NC CSA | 1,829,195 |
| Visalia-Porterville-Hanford, CA CSA | 614,594 |
| Washington-Baltimore-Arlington, DC-MD-VA-WV-PA CSA | 9,764,315 |
| Wausau-Stevens Point-Wisconsin Rapids, WI CSA | 307,170 |
| Wichita-Arkansas City-Winfield, KS CSA | 680,989 |
| Williamsport-Lock Haven, PA CSA | 152,839 |
| Wilmington, NC Metro Area | 288,156 |
| Youngstown-Warren, OH-PA CSA | 645,003 |
| Puerto Rico | 3,337,177 |
| Mayagüez-San Germán, PR CSA | 217,654 |
| Ponce-Coamo-Santa Isabel, PR CSA | 379,748 |
| San Juan-Carolina, PR CSA | 2,398,030 |
___
Metro maps showing counties that comprise some of the Combined Statistical Areas (CSA)


______


March 22, 2018
Business, Did you know?