Mid-2017 Population estimates for United Kingdom, England and Wales, Scotland and Northern Ireland
Office for National Statistics
In mid-2017 the population of the UK was just over 66 million (66,040,229). In the year to mid-2017 the population of the UK increased by 0.6%, or 392,000 people.
The year to mid-2016 had the highest population growth, by number of people, since mid-1948 (538,000).
While the rate of population growth in the year to mid-2017 was slower than in recent years it remains above that seen in the period before 2004.
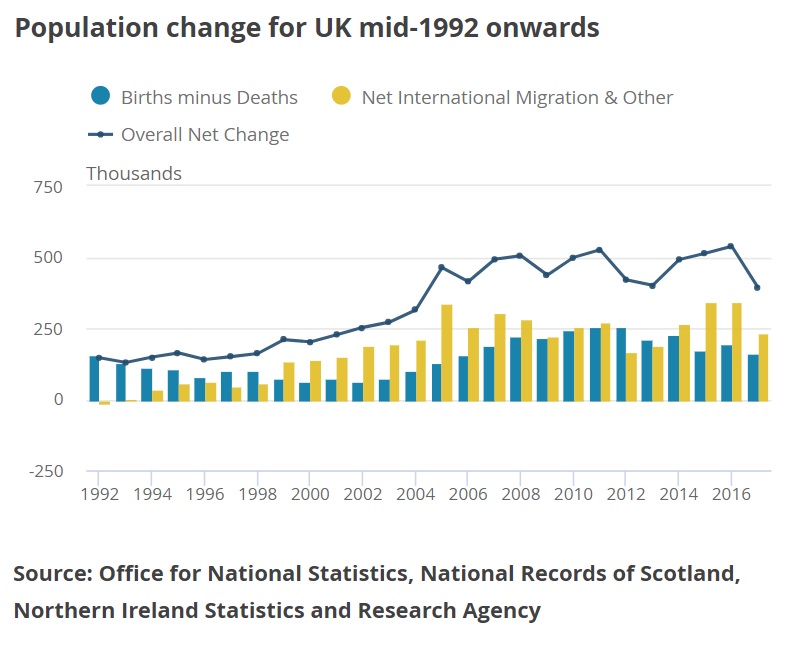
International migration lower, but continues to be the main driver of UK population growth
In the year to mid-2017 international migration, natural change, and other changes have all decreased at the same time. Breaking this down further shows that in the year to mid-2017 there were:
- 572,000 international immigrants, 78,000 fewer than the previous year (a 12% decrease)
- 342,00 international emigrants, 28,000 more than the previous year (a 9% increase)
- 762,000 births, 19,000 fewer than the previous year (a 2% decrease)
- 602,000 deaths, 14,000 more than the previous year (a 2% increase)
The reduction in the number of immigrants is the largest single driver of the lower level of population growth in the year to mid-2017.
However, it is worth noting that immigration in the year to mid-2017 was still 572,000, broadly in line with the average number of immigrants over the last five years (569,000).
The EU referendum is likely to be one of the key drivers of these changes. The Migration Statistics Quarterly Bulletin for this period noted that: “The number of people immigrating for a definite job has remained stable but there has been a 43% decrease in the number of people immigrating to look for work over the last year, especially for EU citizens. These changes suggest that Brexit is likely to be a factor in people’s decision to move to or from the UK – but decisions to migrate are complex and other factors are also going to be influencing the figures.”
International migration
Analysis of the International Passenger Survey (IPS) data that form the basis of these estimates, in the Migration Statistics Quarterly Bulletin, showed that the change to immigration in the year to June 2017 was statistically significant, but emigration was not. Other potential points of interest from this analysis include:
- over the longer term, varying levels of net migration are not unusual and we have seen net migration rise and fall between 140,000 and 336,000 over the last 20 years
- over three-quarters of the decrease in net migration can be accounted for by EU citizens (down 82,000 to +107,000 – a statistically significant decrease)
- the largest inflow of immigrants to the UK was from Romania (50,000) followed by China, India, France and Poland
- the largest outflow of emigrants from the UK was to Australia (31,000) followed by the US, Spain, Poland and France
Growth varies less across the UK; London no longer growing fastest
Of the four countries of the United Kingdom, England’s population grew the fastest to mid-2017, over both a one-year period and a 10-year period.

Population growth decreased, but remained positive in all four countries of the UK. Although England’s rate remained the highest, it had the largest year-on-year decline of the four countries, reflecting the fact that England has a larger proportion of international migrants than might be expected from its share of the overall population. Age structures also affect growth rates – Northern Ireland has the lowest median age of the four countries and is therefore more likely to grow through natural change than the other countries.
- the East Midlands had the fastest population growth of the nine regions of England, at 0.98%; the North East had the slowest, at 0.31%
- London, the fastest growing English region in the year to mid-2016 (1.19%) had the biggest change in growth rate, roughly halving to 0.63% in mid-2017
- at the English County level growth varied from 1.43% in Leicestershire to a 0.08% decrease in Cumbria
Nearly 12 million UK residents aged 65 years and over
The composition of the UK population is determined by the pattern of births, deaths and migration that have taken place in previous years. The pyramid in Figure 3a shows some important trends in the age structure of the UK, comparing the population at mid-2017 and 10 years previously.
The proportion of the population aged 65 years and over reached 18.2% in mid-2017, compared with 18.0% in mid-2016. In mid-2017 there were just under 12 million people aged years 65 and over, 2.2 million more than 10 years before. The proportion of the population aged 65 years and over has increased by at least 0.1% every year since mid-2008, with faster increases between mid-2012 and mid-2014 when the large birth cohort born around 1947 reached age 65 and there was a period of lower net international migration.
It is worth noting that state pension ages are changing. While men’s retirement age in mid-2017 had not yet moved from 65 to 66, the state pension age for women was in the process of moving from 60 to 65.
Impact of cross-border migration on the population of England and Wales
Cross-border moves are where people move, in either direction, between England and Wales (combined) and Northern Ireland and Scotland.
As with the previous year, more people moved out of England and Wales than into England and Wales (a net outflow of 11,037). Flow levels were largest for people aged 19 to 29 years. Net flows to Scotland (from England and Wales) were highest for people aged 18 to 20 and net flows from Scotland (to England and Wales) were highest for people aged 22 to 25 years. Conversely, net flows from Northern Ireland (to England and Wales) were highest for people aged 18 to 20 years.
In the London region, outflows were 9,300 higher than inflows for people aged 19 years, a peak in net outflows despite large numbers moving into London. This is likely to be driven by young adults moving in and out of London for higher education. The number of people moving into London outnumbered the number of people moving out of London for people in their early to late 20s. The peak occurred at age 23 and is likely to be driven by young adults seeking work in London, potentially after they graduated from university. Otherwise, there is a net outflow for all other ages from London, which is highest – after aged 19 years – for people in their 30s and early 40s along with young children.
UK has third highest population in the European Union
An alternative series of population estimates, using a slightly modified cohort component method, is supplied to and published each July by Eurostat (the European Statistics Agency). The difference in method, while small, allows estimates at 1 January to be made, to higher single-years of age. Eurostat’s analysis of these data show that:
- while the population of the EU-28 grew in the calendar year 2016, natural change was negative for the second year running, and therefore net migration into the EU was driving growth
- the rate of population growth since 2005 was slow relative to previous decades, the reverse of the trend in the UK
- Germany, France, the United Kingdom and Italy together comprised more than half (54.0 %) of the total EU-28 population on 1 January 2017

London
8,825,001
4,398,848 males
4,426,153 females
City of London
7,654
4,153 males
3,501 females
Greater Manchester
2,798,799
1,389,674 males
1,409,125 females
Manchester
545,501
276,213 males
269,288 females
West Midlands
5,860,706
2,904,272 males
2,956,434 females
Birmingham
1,137,123
562,742 males
574,381 females
East Midlands
4,771,666
2,359,406 malesfe
2,412,260 females
Nottingham
329,209
166,828 males
162,381 females
Leicester
353,540
176,820 males
176,720 females
Derby
257,034
127,357 males
129,677 females
West Yorkshire
2,307,035
1,136,114 males
1,170,921 females
Leeds
784,846
385,254 males
399,592 females
Glasgow
621,020
302,813 males
318,207 females
Southhampton
252,359
128,749 males
123,610 females
Portsmouth
214,718
109,264 malesfe
105,454 females
Liverpool
491,549
244,710 males
246,839 females
Newcastle-under-Lyme
128,963
64,103 malesfe
64,860 female
Newcastle upon Tyne
295,842
149,436 malesfe
146,406 female
Sheffield
577,789
287,391 males
290,398 females
City of Bristol
459,252
229,953 males
229,299 females
City of Edinburgh
513,210
250,129 males
263,081 females
Aberdeen
228,800
113,852 males
114,948 females
Dundee
148,710
71,694 males
77,016 females


June 28, 2018
Did you know?, International