2017 Population estimate for where African Americans live- States and Metropolitan Areas
Release Date September 13, 2018
Source: U.S. Department of Commerce – U.S. Census Bureau
SEPT. 13, 2018 — The U.S. Census Bureau released its most detailed look at Americas people and places. This data also includes the African American population.
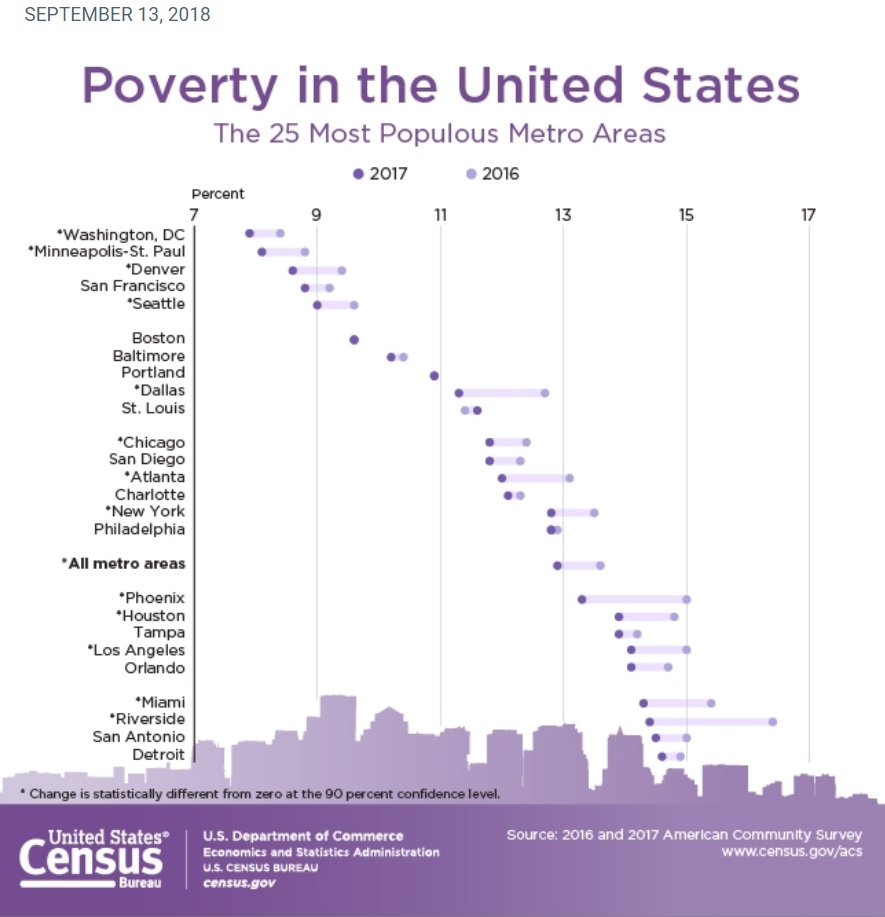
Many large metropolitan areas saw an increase in income and a decrease in poverty rates between 2016 and 2017.
Where do African Americans live in the United States:
| State | 2017 Black/African American Population |
| Texas | 3,712,453 |
| Florida | 3,692,327 |
| Georgia | 3,448,934 |
| New York | 3,436,650 |
| California | 2,775,059 |
| North Carolina | 2,357,777 |
| Illinois | 1,953,739 |
| Maryland | 1,927,464 |
| Virginia | 1,795,098 |
| Ohio | 1,661,333 |
| Pennsylvania | 1,631,167 |
| Louisiana | 1,573,145 |
| Michigan | 1,522,134 |
| South Carolina | 1,415,272 |
| Alabama | 1,356,161 |
| New Jersey | 1,332,592 |
| Tennessee | 1,198,891 |
| Mississippi | 1,156,352 |
| Missouri | 778,856 |
| Indiana | 722,316 |
| Massachusetts | 645,572 |
| Puerto Rico | 563,738 |
| Arkansas | 490,755 |
| Connecticut | 445,192 |
| Wisconsin | 433,227 |
| Minnesota | 425,197 |
| Kentucky | 422,196 |
| Washington | 404,766 |
| Arizona | 399,987 |
| Oklahoma | 361,077 |
| District of Columbia | 329,696 |
| Nevada | 318,612 |
| Colorado | 296,260 |
| Delaware | 228,746 |
| Kansas | 213,694 |
| Iowa | 144,803 |
| Oregon | 124,365 |
| Nebraska | 115,073 |
| West Virginia | 92,106 |
| Rhode Island | 83,646 |
| New Mexico | 63,684 |
| Utah | 54,113 |
| Hawaii | 52,782 |
| Alaska | 34,537 |
| New Hampshire | 31,323 |
| North Dakota | 26,636 |
| Maine | 24,268 |
| South Dakota | 23,490 |
| Idaho | 20,869 |
| Vermont | 13,044 |
| Montana | 11,152 |
| Wyoming | 10,600 |
_________
Where do African Americans live in metropolitan areas
| Metropolitan Region | 2017 Black/African American Population | 2017 Population of Entire Metropolitan Region |
| New York-Newark, NY-NJ-CT-PA CSA | 4,218,010 | 23,876,155 |
| Washington-Baltimore-Arlington, DC-MD-VA-WV-PA CSA | 2,651,200 | 9,764,315 |
| Atlanta–Athens-Clarke County–Sandy Springs, GA CSA | 2,206,982 | 6,555,956 |
| Chicago-Naperville, IL-IN-WI CSA | 1,708,306 | 9,901,711 |
| Philadelphia-Reading-Camden, PA-NJ-DE-MD CSA | 1,553,892 | 7,206,807 |
| Miami-Fort Lauderdale-Port St. Lucie, FL CSA | 1,484,818 | 6,828,241 |
| Los Angeles-Long Beach, CA CSA | 1,443,699 | 18,788,800 |
| Houston-The Woodlands, TX CSA | 1,292,925 | 7,093,190 |
| Dallas-Fort Worth, TX-OK CSA | 1,279,293 | 7,846,293 |
| Detroit-Warren-Ann Arbor, MI CSA | 1,165,646 | 5,336,286 |
| Boston-Worcester-Providence, MA-RI-NH-CT CSA | 694,283 | 8,233,270 |
| Memphis-Forrest City, TN-MS-AR CSA | 656,576 | 1,374,190 |
| San Jose-San Francisco-Oakland, CA CSA | 653,553 | 8,837,789 |
| Charlotte-Concord, NC-SC CSA | 635,821 | 2,684,121 |
| Cleveland-Akron-Canton, OH CSA | 599,363 | 3,485,691 |
| Virginia Beach-Norfolk, VA-NC CSA | 599,170 | 1,829,195 |
| St. Louis-St. Charles-Farmington, MO-IL CSA | 556,343 | 2,911,945 |
| Orlando-Deltona-Daytona Beach, FL CSA | 555,838 | 3,284,198 |
| New Orleans-Metairie-Hammond, LA-MS CSA | 526,433 | 1,510,162 |
| Raleigh-Durham-Chapel Hill, NC CSA | 525,339 | 2,199,459 |
| San Juan-Carolina, PR CSA | 464,170 | 2,398,030 |
| Tampa-St. Petersburg-Clearwater, FL Metro Area | 438,349 | 3,091,399 |
| Richmond, VA Metro Area | 412,967 | 1,294,204 |
| Birmingham-Hoover-Talladega, AL CSA | 387,740 | 1,364,062 |
| Columbus-Marion-Zanesville, OH CSA | 387,685 | 2,481,585 |
| Minneapolis-St. Paul, MN-WI CSA | 379,023 | 3,946,533 |
| Greensboro–Winston-Salem–High Point, NC CSA | 379,019 | 1,663,532 |
| Jacksonville-St. Marys-Palatka, FL-GA CSA | 372,328 | 1,631,488 |
| Indianapolis-Carmel-Muncie, IN CSA | 359,116 | 2,411,086 |
| Columbia-Orangeburg-Newberry, SC CSA | 357,434 | 950,997 |
| Seattle-Tacoma, WA CSA | 340,784 | 4,764,736 |
| Jackson-Vicksburg-Brookhaven, MS CSA | 334,001 | 668,780 |
| Phoenix-Mesa-Scottsdale, AZ Metro Area | 325,138 | 4,737,270 |
| Kansas City-Overland Park-Kansas City, MO-KS CSA | 319,043 | 2,472,602 |
| Nashville-Davidson–Murfreesboro, TN CSA | 318,859 | 2,027,489 |
| Milwaukee-Racine-Waukesha, WI CSA | 318,182 | 2,048,007 |
| Cincinnati-Wilmington-Maysville, OH-KY-IN CSA | 304,945 | 2,238,265 |
| Las Vegas-Henderson, NV-AZ CSA | 301,491 | 2,455,481 |
| Greenville-Spartanburg-Anderson, SC CSA | 282,433 | 1,459,766 |
| Pittsburgh-New Castle-Weirton, PA-OH-WV CSA | 243,172 | 2,623,639 |
| Little Rock-North Little Rock, AR CSA | 232,928 | 908,323 |
| Louisville/Jefferson County–Elizabethtown–Madison, KY-IN CSA | 229,662 | 1,522,112 |
| Augusta-Richmond County, GA-SC Metro Area | 221,028 | 600,151 |
| Sacramento-Roseville, CA CSA | 220,954 | 2,598,377 |
| San Diego-Carlsbad, CA Metro Area | 213,289 | 3,337,685 |
| Denver-Aurora, CO CSA | 206,508 | 3,515,374 |
| Fayetteville-Lumberton-Laurinburg, NC CSA | 203,891 | 554,361 |
| San Antonio-New Braunfels, TX Metro Area | 197,109 | 2,473,974 |
| Columbus-Auburn-Opelika, GA-AL CSA | 188,243 | 499,128 |
| Savannah-Hinesville-Statesboro, GA CSA | 188,238 | 544,092 |
| Hartford-West Hartford, CT CSA | 183,989 | 1,479,292 |
| Austin-Round Rock, TX Metro Area | 182,883 | 2,115,827 |
| Lafayette-Opelousas-Morgan City, LA CSA | 182,088 | 626,028 |
| Oklahoma City-Shawnee, OK CSA | 175,864 | 1,455,963 |
| Macon-Bibb County–Warner Robins, GA CSA | 174,824 | 420,693 |
| Montgomery, AL Metro Area | 171,591 | 373,889 |
| Mobile-Daphne-Fairhope, AL CSA | 171,553 | 626,583 |
| Dayton-Springfield-Sidney, OH CSA | 159,050 | 1,077,108 |
| Buffalo-Cheektowaga, NY CSA | 158,742 | 1,214,204 |
| Rochester-Batavia-Seneca Falls, NY CSA | 148,186 | 1,170,402 |
| Rocky Mount-Wilson-Roanoke Rapids, NC CSA | 145,843 | 299,581 |
| Tallahassee-Bainbridge, FL-GA CSA | 138,911 | 409,343 |
| Huntsville-Decatur-Albertville, AL CSA | 131,440 | 774,480 |
| Grand Rapids-Wyoming-Muskegon, MI CSA | 123,620 | 1,456,935 |
| Portland-Vancouver-Salem, OR-WA CSA | 120,506 | 3,201,058 |
| Harrisburg-York-Lebanon, PA CSA | 115,703 | 1,260,071 |
| Tulsa-Muskogee-Bartlesville, OK CSA | 110,842 | 1,160,612 |
| Pensacola-Ferry Pass, FL-AL CSA | 103,876 | 525,231 |
| Albany-Schenectady, NY CSA | 100,627 | 1,176,079 |
| Toledo-Port Clinton, OH CSA | 99,953 | 644,325 |
| Chattanooga-Cleveland-Dalton, TN-GA-AL CSA | 99,823 | 960,782 |
| Monroe-Ruston-Bastrop, LA CSA | 98,920 | 251,830 |
| Cape Coral-Fort Myers-Naples, FL CSA | 96,919 | 1,112,104 |
| Gulfport-Biloxi-Pascagoula, MS Metro Area | 91,887 | 394,232 |
| Omaha-Council Bluffs-Fremont, NE-IA CSA | 86,044 | 970,023 |
| South Bend-Elkhart-Mishawaka, IN-MI CSA | 85,387 | 727,604 |
| Myrtle Beach-Conway, SC-NC CSA | 80,628 | 525,772 |
| Lexington-Fayette–Richmond–Frankfort, KY CSA | 79,891 | 740,364 |
| Greenville-Washington, NC CSA | 77,684 | 226,130 |
| Ponce-Coamo-Santa Isabel, PR CSA | 77,480 | 377,044 |
| Gainesville-Lake City, FL CSA | 75,489 | 354,299 |
| North Port-Sarasota, FL CSA | 74,851 | 1,023,585 |
| Syracuse-Auburn, NY CSA | 71,090 | 732,444 |
| Youngstown-Warren, OH-PA CSA | 71,018 | 645,003 |
| Knoxville-Morristown-Sevierville, TN CSA | 68,781 | 1,128,379 |
| Fresno-Madera, CA CSA | 63,246 | 1,146,145 |
| Wichita-Arkansas City-Winfield, KS CSA | 62,699 | 680,989 |
| Lake Charles-Jennings, LA CSA | 61,771 | 240,834 |
| Springfield-Greenfield Town, MA CSA | 60,068 | 702,354 |
| Kalamazoo-Battle Creek-Portage, MI CSA | 58,864 | 533,413 |
| Dothan-Enterprise-Ozark, AL CSA | 57,493 | 249,014 |
| Fort Wayne-Huntington-Auburn, IN CSA | 54,934 | 631,217 |
| Lansing-East Lansing-Owosso, MI CSA | 54,023 | 546,102 |
| Longview-Marshall, TX CSA | 52,040 | 284,142 |
| Jackson-Brownsville, TN CSA | 51,607 | 146,808 |
| Rockford-Freeport-Rochelle, IL CSA | 50,773 | 434,408 |
| Salt Lake City-Provo-Orem, UT CSA | 49,734 | 2,559,350 |
| Tucson-Nogales, AZ CSA | 49,446 | 1,068,981 |
| Tyler-Jacksonville, TX CSA | 49,336 | 1,160,612 |
| Madison-Janesville-Beloit, WI CSA | 48,106 | 880,520 |
| Des Moines-Ames-West Des Moines, IA CSA | 47,321 | 806,863 |
| Saginaw-Midland-Bay City, MI CSA | 45,064 | 379,584 |
| Peoria-Canton, IL CSA | 41,962 | 407,537 |
| El Paso-Las Cruces, TX-NM CSA | 41,942 | 1,060,397 |
| Davenport-Moline, IA-IL CSA | 40,892 | 472,153 |
| Columbus-West Point, MS CSA | 38,682 | 78,826 |
| Albuquerque-Santa Fe-Las Vegas, NM CSA | 36,836 | 1,171,974 |
| Charleston-Huntington-Ashland, WV-OH-KY CSA | 36,057 | 679,734 |
| Springfield-Jacksonville-Lincoln, IL CSA | 34,549 | 309,844 |
| New Bern-Morehead City, NC CSA | 33,196 | 193,745 |
| Modesto-Merced, CA CSA | 31,024 | 820,572 |
| Hickory-Lenoir, NC CSA | 30,346 | 411,693 |
| Cedar Rapids-Iowa City, IA CSA | 29,791 | 441,784 |
| Asheville-Brevard, NC CSA | 27,828 | 490,101 |
| Erie-Meadville, PA CSA | 27,561 | 360,700 |
| Lubbock-Levelland, TX CSA | 26,335 | 340,071 |
| Harrisonburg-Staunton-Waynesboro, VA CSA | 23,065 | 256,441 |
| Columbia-Moberly-Mexico, MO CSA | 22,363 | 228,857 |
| Visalia-Porterville-Hanford, CA CSA | 21,180 | 614,594 |
| Midland-Odessa, TX CSA | 20,537 | 327,762 |
| Corpus Christi-Kingsville-Alice, TX CSA | 19,616 | 526,384 |
| Amarillo-Borger, TX CSA | 19,499 | 286,300 |
| Jonesboro-Paragould, AR CSA | 18,873 | 176,322 |
| Johnson City-Kingsport-Bristol, TN-VA CSA | 18,495 | 508,712 |
| Lincoln-Beatrice, NE CSA | 18,468 | 353,120 |
| Rome-Summerville, GA CSA | 17,607 | 122,383 |
| Spokane-Spokane Valley-Coeur d’Alene, WA-ID CSA | 17,534 | 721,873 |
| Bloomington-Pontiac, IL CSA | 17,124 | 224,750 |
| Reno-Carson City-Fernley, NV CSA | 17,099 | 621,769 |
| Bowling Green-Glasgow, KY CSA | 17,026 | 228,743 |
| Portland-Lewiston-South Portland, ME CSA | 16,977 | 639,734 |
| Lima-Van Wert-Celina, OH CSA | 16,811 | 218,066 |
| Springfield-Branson, MO CSA | 15,698 | 549,423 |
| Boise City-Mountain Home-Ontario, ID-OR CSA | 14,864 | 790,363 |
| Mansfield-Ashland-Bucyrus, OH CSA | 14,812 | 215,963 |
| Hot Springs-Malvern, AR CSA | 14,399 | 132,232 |
| Cape Girardeau-Sikeston, MO-IL CSA | 14,383 | 135,323 |
| Rochester-Austin, MN CSA | 14,089 | 257,846 |
| DeRidder-Fort Polk South, LA CSA | 14,023 | 87,654 |
| Fargo-Wahpeton, ND-MN CSA | 13,601 | 264,031 |
| Lafayette-West Lafayette-Frankfort, IN CSA | 12,935 | 251,556 |
| Paducah-Mayfield, KY-IL CSA | 11,979 | 134,158 |
| Manhattan-Junction City, KS CSA | 11,859 | 131,935 |
| Kokomo-Peru, IN CSA | 10,999 | 118,208 |
| State College-DuBois, PA CSA | 10,998 | 242,345 |
| Green Bay-Shawano, WI CSA | 10,386 | 365,600 |
| Morgantown-Fairmont, WV CSA | 10,349 | 195,046 |
| Appleton-Oshkosh-Neenah, WI CSA | 9,745 | 406,540 |
| Elmira-Corning, NY CSA | 9,615 | 181,838 |
| Johnstown-Somerset, PA CSA | 9,347 | 207,555 |
| Bloomsburg-Berwick-Sunbury, PA CSA | 9,236 | 261,629 |
| Martin-Union City, TN-KY CSA | 8,173 | 69,914 |
| Williamsport-Lock Haven, PA CSA | 7,733 | 152,839 |
| Victoria-Port Lavaca, TX CSA | 7,723 | 121,390 |
| Bloomington-Bedford, IN CSA | 7,654 | 213,491 |
| Pueblo-Cañon City, CO CSA | 7,254 | 214,034 |
| Mayagüez-San Germán, PR CSA | 7,247 | 218,438 |
| Sioux City-Vermillion, IA-SD-NE CSA | 6,059 | 182,608 |
| Quincy-Hannibal, IL-MO CSA | 5,884 | 115,059 |
| Ithaca-Cortland, NY CSA | 5,869 | 152,588 |
| Clovis-Portales, NM CSA | 5,855 | 68,659 |
| McAllen-Edinburg, TX CSA | 5,796 | 925,115 |
| Findlay-Tiffin, OH CSA | 5,713 | 130,997 |
| Joplin-Miami, MO-OK CSA | 5,586 | 209,819 |
| Mount Pleasant-Alma, MI CSA | 5,449 | 112,081 |
| Richmond-Connersville, IN CSA | 5,384 | 89,394 |
| Redding-Red Bluff, CA CSA | 4,840 | 243,847 |
| Medford-Grants Pass, OR CSA | 4,633 | 303,831 |
| Wausau-Stevens Point-Wisconsin Rapids, WI CSA | 4,446 | 307,170 |
| Mankato-New Ulm-North Mankato, MN CSA | 4,163 | 126,133 |
| Rapid City-Spearfish, SD CSA | 4,045 | 172,279 |
| Eau Claire-Menomonie, WI CSA | 3,959 | 212,177 |
| Dixon-Sterling, IL CSA | 3,690 | 90,524 |
| Parkersburg-Marietta-Vienna, WV-OH CSA | 3,011 | 151,316 |
| Pullman-Moscow, WA-ID CSA | 2,171 | 88,379 |
| Brownsville-Harlingen-Raymondville, TX CSA | 1,993 | 445,309 |
| Bend-Redmond-Prineville, OR CSA | 1,854 | 209,998 |
| Idaho Falls-Rexburg-Blackfoot, ID CSA | 1,322 | 243,805 |
| Edwards-Glenwood Springs, CO CSA | 1,036 | 131,780 |
| Moses Lake-Othello, WA CSA | 819 | 114,664 |
______________
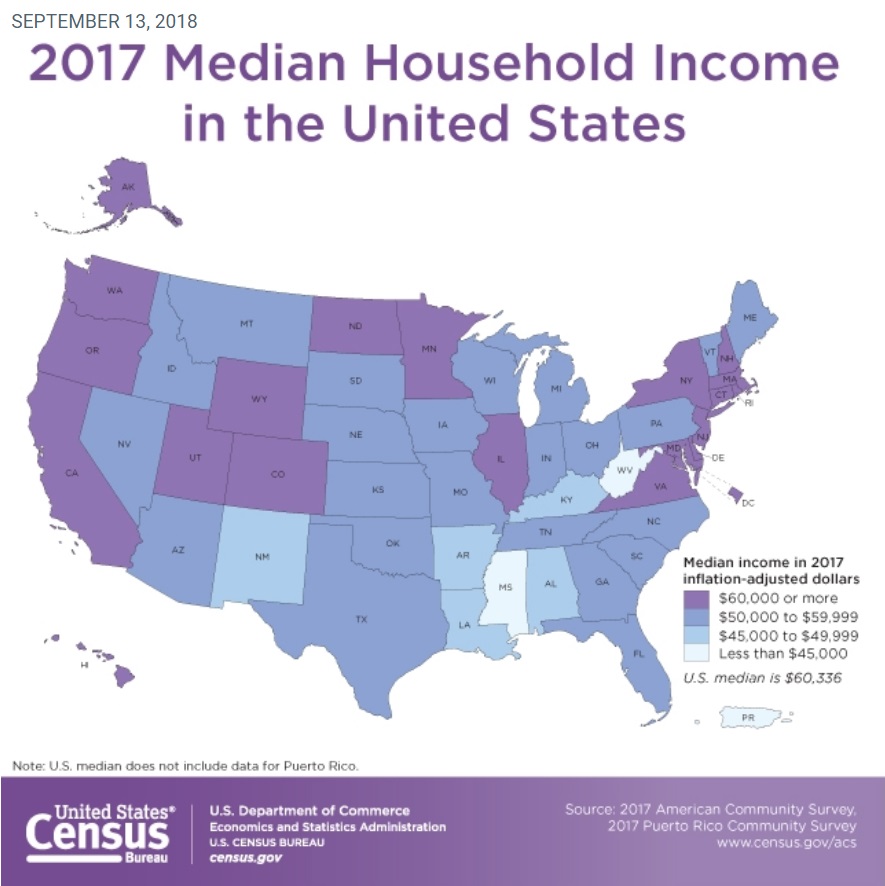
Median Household Income for all races and ethnic groups:

Poverty in the United States for all races and ethnic groups:


October 5, 2018
Africa, Did you know?, Government/Politics