U.S. Census Bureau releases 2012 population estimates for states, counties and metropolitan areas
Dilemma X
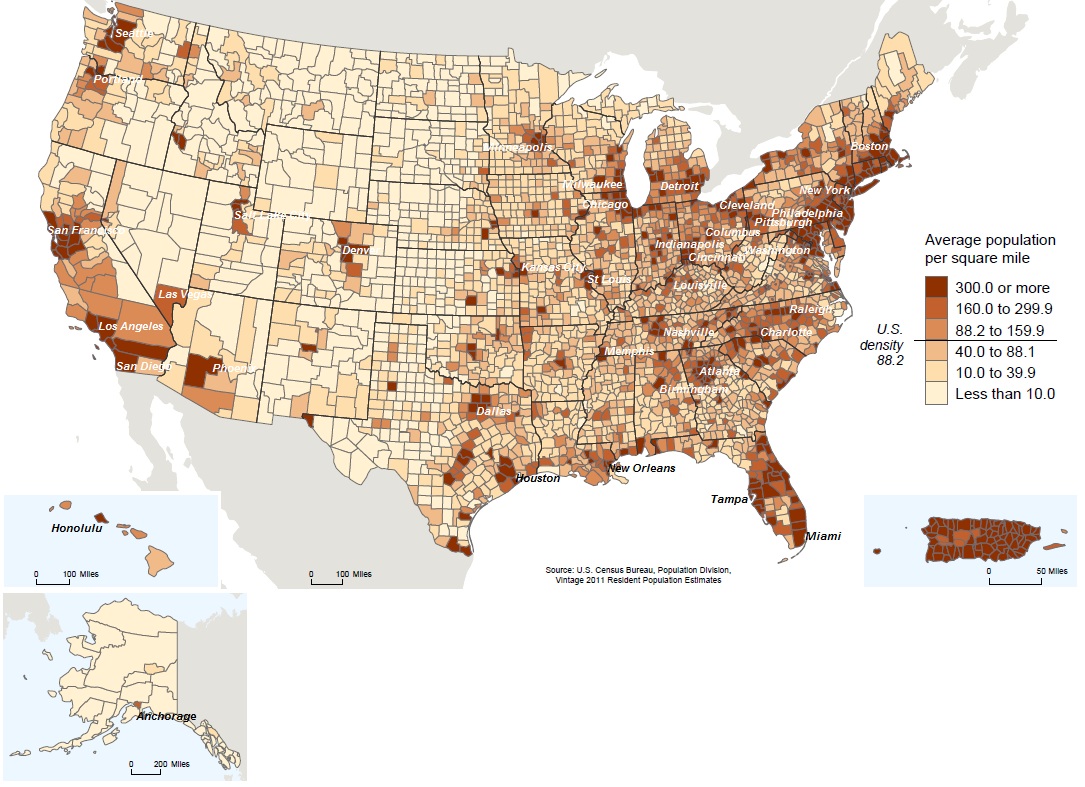
The U.S. Census Bureau has released its latest population estimates for states, counties and metropolitan areas. Dilemma X has shared selected data for: states, various counties and various metropolitan areas.
Metropolitan statistical areas and their larger Combined Statistical Areas are geographic entities delineated by the Office of Management and Budget (OMB). This data is then used by Federal statistical agencies in collecting, tabulating, and publishing Federal statistics.
The next Census will take place in 2020, until that time the U.S. Census Bureau will release estimate updates.
Data Release Date: March 2013
Source: U.S. Census Bureau, Population Division
The 10 Counties with the Largest Numeric Increase from July 1, 2011, to July 1, 2012
The following counties grew by the population shown in 1 year:
1. Harris, Texas (Houston) 80,005
2. Los Angeles, Calif. 73,764
3. Maricopa, Ariz .(Phoenix) 73,644
4. Dallas, Texas 45,827
5. San Diego, Calif. 38,880
6. King, Wash. (Seattle) 35,838
7. Travis, Texas (Austin) 34,381
8. Orange, Calif. (Anaheim) 34,017
9. Tarrant, Texas (Fort Worth) 32,997
10. Clark, Nev. (Las Vegas) 32,833
Largest U.S. metropolitan areas by population
| Metropolitan Combined Statistical Area | ||
| Census April 1, 2010 | Population estimates as of July 1, 2012 | |
| New York-Newark, NY-NJ-CT-PA | 23,076,664 | 23,362,099 |
| Los Angeles-Long Beach, CA | 17,877,006 | 18,238,998 |
| Chicago-Naperville, IL-IN-WI | 9,840,929 | 9,899,902 |
| Washington-Baltimore-Arlington, DC-MD-VA-WV-PA | 9,051,961 | 9,331,587 |
| San Jose-San Francisco-Oakland, CA | 8,153,696 | 8,370,967 |
| Boston-Worcester-Providence, MA-RI-NH-CT | 7,893,376 | 7,991,371 |
| Philadelphia-Reading-Camden, PA-NJ-DE-MD | 7,067,807 | 7,129,428 |
| Dallas-Fort Worth, TX-OK | 6,817,483 | 7,095,411 |
| Miami-Fort Lauderdale-Port St. Lucie, FL | 6,166,766 | 6,375,434 |
| Houston-The Woodlands, TX | 6,114,562 | 6,371,677 |
| Atlanta–Athens-Clarke County–Sandy Springs, GA | 5,910,296 | 6,092,295 |
| Detroit-Warren-Ann Arbor, MI | 5,318,744 | 5,311,449 |
| Seattle-Tacoma, WA | 4,274,767 | 4,399,332 |
| Phoenix-Mesa-Scottsdale, AZ | 4,192,887 | 4,329,534 |
| Minneapolis-St. Paul, MN-WI | 3,684,928 | 3,759,978 |
| Cleveland-Akron-Canton, OH | 3,515,646 | 3,497,711 |
| Denver-Aurora, CO | 3,090,874 | 3,214,218 |
| San Diego-Carlsbad, CA | 3,095,313 | 3,177,063 |
| Portland-Vancouver-Salem, OR-WA | 2,921,408 | 2,992,924 |
| Orlando-Deltona-Daytona Beach, FL | 2,818,120 | 2,920,603 |
| Saint Louis-St. Charles-Farmington, MO-IL | 2,892,497 | 2,900,605 |
| Tampa-St. Petersburg-Clearwater, FL | 2,783,243 | 2,842,878 |
| Pittsburgh-New Castle-Weirton, PA-OH-WV | 2,660,727 | 2,661,369 |
| San Juan-Carolina, PR | 2,664,889 | 2,627,081 |
| Charlotte-Concord, NC-SC | 2,375,675 | 2,454,619 |
| Sacramento-Roseville, CA | 2,414,783 | 2,462,722 |
| Kansas City-Overland Park-Kansas City, MO-KS | 2,343,008 | 2,376,631 |
| Salt Lake City-Provo-Orem, UT | 2,271,696 | 2,350,274 |
| Columbus-Marion-Zanesville, OH | 2,308,509 | 2,348,495 |
| Indianapolis-Carmel-Muncie, IN | 2,266,569 | 2,310,360 |
| Las Vegas-Henderson, NV-AZ | 2,195,401 | 2,247,056 |
| San Antonio-New Braunfels, TX | 2,142,508 | 2,234,003 |
| Cincinnati-Wilmington-Maysville, OH-KY-IN | 2,174,110 | 2,188,001 |
| Milwaukee-Racine-Waukesha, WI | 2,025,989 | 2,037,542 |
| Raleigh-Durham-Chapel Hill, NC | 1,912,729 | 1,998,808 |
| Nashville-Davidson–Murfreesboro, TN | 1,788,434 | 1,845,235 |
| Austin-Round Rock, TX | 1,716,289 | 1,834,303 |
| Virginia Beach-Norfolk, VA-NC | 1,779,243 | 1,803,080 |
| Greensboro–Winston-Salem–High Point, NC | 1,589,200 | 1,611,243 |
| Providence-Warwick, RI-MA | 1,600,852 | 1,601,374 |
| Jacksonville-St. Marys-Palatka, FL-GA | 1,470,473 | 1,502,515 |
| Hartford-West Hartford, CT | 1,486,436 | 1,488,570 |
| Louisville/Jefferson County–Elizabethtown–Madison, KY-IN | 1,459,911 | 1,478,637 |
| New Orleans-Metairie-Hammond, LA-MS | 1,413,965 | 1,452,502 |
| Greenville-Spartanburg-Anderson, SC | 1,362,073 | 1,384,996 |
| Memphis-Forrest City, TN-MS-AR | 1,353,087 | 1,369,548 |
| Oklahoma City-Shawnee, OK | 1,322,429 | 1,367,325 |
| Birmingham-Hoover-Talladega, AL | 1,302,283 | 1,309,818 |
| Richmond-Petersburg, VA | 1,208,101 | 1,231,980 |
| Harrisburg-York-Lebanon, PA | 1,219,422 | 1,228,559 |
| Buffalo-Cheektowaga, NY | 1,215,826 | 1,213,668 |
| Rochester-Batavia-Seneca Falls, NY | 1,175,001 | 1,177,566 |
| Tulsa-Muskogee-Bartlesville, OK | 1,106,431 | 1,122,259 |
| Fresno-Madera, CA | 1,081,315 | 1,100,113 |
| Knoxville-Morristown-Sevierville, TN | 1,077,073 | 1,091,370 |
| Dayton-Springfield-Sidney, OH | 1,080,044 | 1,079,417 |
| El Paso-Las Cruces, TX-NM | 1,013,356 | 1,045,180 |
| Tucson-Nogales, AZ | 1,027,683 | 1,039,697 |
_________________________________________________________
Some other U.S. metropolitan areas of interest by population
| Metropolitan Combined Statistical Area | ||
| Census April 1, 2010 | Population estimates as of July 1, 2012 | |
| Cape Coral-Fort Myers-Naples, FL | 940,274 | 977,720 |
| Honolulu, HI | 953,207 | 976,372 |
| Chattanooga-Cleveland-Dalton, TN-GA-AL | 923,460 | 936,142 |
| Omaha-Council Bluffs-Fremont, NE-IA | 902,041 | 922,051 |
| North Port-Sarasota, FL | 897,121 | 917,203 |
| Columbia-Orangeburg-Newberry, SC | 897,607 | 913,797 |
| Albuquerque, NM | 887,077 | 901,700 |
| Little Rock-North Little Rock, AR | 877,091 | 893,610 |
| McAllen-Edinburg, TX | 835,737 | 868,167 |
| Modesto-Merced, CA | 770,246 | 784,031 |
| Des Moines-Ames-West Des Moines, IA | 722,323 | 742,936 |
| Syracuse-Auburn, NY | 742,603 | 740,486 |
| South Bend-Elkhart-Mishawaka, IN-MI | 720,647 | 721,296 |
| Charleston-Huntington-Ashland, WV-OH-KY | 708,228 | 705,264 |
| Lexington-Fayette–Richmond–Frankfort, KY | 687,173 | 703,271 |
| Springfield-Greenfield Town, MA | 692,942 | 697,258 |
| Huntsville-Decatur-Albertville, AL | 664,441 | 679,743 |
| Spokane-Spokane Valley-Coeur d’Alene, WA-ID | 666,247 | 674,610 |
| Wichita-Arkansas City-Winfield, KS | 667,230 | 672,393 |
| Jackson-Vicksburg-Brookhaven, MS | 660,368 | 669,133 |
| Youngstown-Warren, OH-PA | 673,614 | 664,713 |
| Toledo-Port Clinton, OH | 651,429 | 650,050 |
| Portland-Lewiston-South Portland, ME | 621,800 | 625,726 |
| Fort Wayne-Huntington-Auburn, IN | 611,712 | 616,785 |
| Lafayette-Opelousas-Morgan City, LA | 604,784 | 611,774 |
| Mobile-Daphne-Fairhope, AL | 595,257 | 604,726 |
| Reno-Carson City-Fernley, NV | 579,668 | 587,004 |
| Augusta-Richmond County, GA-SC | 564,873 | 575,898 |
| Fayetteville-Lumberton-Laurinburg, NC | 536,708 | 546,175 |
| Lansing-East Lansing-Owosso, MI | 534,684 | 534,964 |
| Kalamazoo-Battle Creek-Portage, MI | 524,030 | 525,929 |
| Savannah-Hinesville-Statesboro, GA | 495,745 | 516,154 |
| Corpus Christi-Kingsville-Alice, TX | 501,500 | 511,319 |
| Johnson City-Kingsport-Bristol, TN-VA | 508,260 | 509,690 |
| Columbus-Auburn-Opelika, GA-AL | 469,327 | 491,852 |
| Davenport-Moline, IA-IL | 471,551 | 474,226 |
| Myrtle Beach-Conway, SC-NC | 436,880 | 454,731 |
| Macon-Warner Robins, GA | 411,898 | 418,201 |
| Hickory-Lenoir, NC | 410,493 | 408,625 |
| Tallahassee-Bainbridge, FL-GA | 395,255 | 402,880 |
| Montgomery, AL | 374,536 | 377,149 |
______________________________________________________________
America’s fastest growing region– The South
Largest Southern U.S. metropolitan areas

| Metropolitan Combined Statistical Area | |
| Population estimates as of July 1, 2012 | |
| Washington-Baltimore-Arlington, DC-MD-VA-WV-PA | 9,331,587 |
| Dallas-Fort Worth, TX-OK | 7,095,411 |
| Miami-Fort Lauderdale-Port St. Lucie, FL | 6,375,434 |
| Houston-The Woodlands, TX | 6,371,677 |
| Atlanta–Athens-Clarke County–Sandy Springs, GA | 6,092,295 |
| Orlando-Deltona-Daytona Beach, FL | 2,920,603 |
| Tampa-St. Petersburg-Clearwater, FL | 2,842,878 |
| Charlotte-Concord, NC-SC | 2,454,619 |
| San Antonio-New Braunfels, TX | 2,234,003 |
| Raleigh-Durham-Chapel Hill, NC | 1,998,808 |
| Nashville-Davidson–Murfreesboro, TN | 1,845,235 |
| Virginia Beach-Norfolk, VA-NC | 1,803,080 |
| Greensboro–Winston-Salem–High Point, NC | 1,611,243 |
| Jacksonville-St. Marys-Palatka, FL-GA | 1,502,515 |
| Louisville/Jefferson County–Elizabethtown–Madison, KY-IN | 1,478,637 |
| New Orleans-Metairie-Hammond, LA-MS | 1,452,502 |
| Greenville-Spartanburg-Anderson, SC | 1,384,996 |
| Memphis-Forrest City, TN-MS-AR | 1,369,548 |
| Birmingham-Hoover-Talladega, AL | 1,309,818 |
| Richmond-Petersburg, VA | 1,231,980 |
| Knoxville-Morristown-Sevierville, TN | 1,091,370 |
_______________
Classic older metropolitan areas- Industrial

| Metropolitan Combined Statistical Area | |
| Population estimates as of July 1, 2012 | |
| New York-Newark, NY-NJ-CT-PA | 23,362,099 |
| Chicago-Naperville, IL-IN-WI | 9,899,902 |
| Boston-Worcester-Providence, MA-RI-NH-CT | 7,991,371 |
| Philadelphia-Reading-Camden, PA-NJ-DE-MD | 7,129,428 |
| Detroit-Warren-Ann Arbor, MI | 5,311,449 |
| Minneapolis-St. Paul, MN-WI | 3,759,978 |
| Cleveland-Akron-Canton, OH | 3,497,711 |
| Saint Louis-St. Charles-Farmington, MO-IL | 2,900,605 |
| Pittsburgh-New Castle-Weirton, PA-OH-WV | 2,661,369 |
| Kansas City-Overland Park-Kansas City, MO-KS | 2,376,631 |
| Columbus-Marion-Zanesville, OH | 2,348,495 |
| Indianapolis-Carmel-Muncie, IN | 2,310,360 |
| Cincinnati-Wilmington-Maysville, OH-KY-IN | 2,188,001 |
| Milwaukee-Racine-Waukesha, WI | 2,037,542 |
| Providence-Warwick, RI-MA | 1,601,374 |
| Hartford-West Hartford, CT | 1,488,570 |
| Harrisburg-York-Lebanon, PA | 1,228,559 |
| Buffalo-Cheektowaga, NY | 1,213,668 |
| Rochester-Batavia-Seneca Falls, NY | 1,177,566 |
| Dayton-Springfield-Sidney, OH | 1,079,417 |
_______________
Western metropolitan areas- The West

| Metropolitan Combined Statistical Area | |
| Population estimates as of July 1, 2012 | |
| Los Angeles-Long Beach, CA | 18,238,998 |
| San Jose-San Francisco-Oakland, CA | 8,370,967 |
| Seattle-Tacoma, WA | 4,399,332 |
| Phoenix-Mesa-Scottsdale, AZ | 4,329,534 |
| Denver-Aurora, CO | 3,214,218 |
| San Diego-Carlsbad, CA | 3,177,063 |
| Portland-Vancouver-Salem, OR-WA | 2,992,924 |
| Sacramento-Roseville, CA | 2,462,722 |
| Salt Lake City-Provo-Orem, UT | 2,350,274 |
| Las Vegas-Henderson, NV-AZ | 2,247,056 |
| Fresno-Madera, CA | 1,100,113 |
| Tucson-Nogales, AZ | 1,039,697 |
| Honolulu, HI | 976,372 |
| Reno-Carson City-Fernley, NV | 587,004 |
| Anchorage, AK | 392,535 |
_______________
U.S. Census state population rankings as of 2012
| Geography | Census April 1, 2010 | Population Estimates as of July 1, 2012 |
| United States | 308,745,538 | 313,914,040 |
| California | 37,253,956 | 38,041,430 |
| Texas | 25,145,561 | 26,059,203 |
| New York | 19,378,102 | 19,570,261 |
| Florida | 18,801,310 | 19,317,568 |
| Illinois | 12,830,632 | 12,875,255 |
| Pennsylvania | 12,702,379 | 12,763,536 |
| Ohio | 11,536,504 | 11,544,225 |
| Georgia | 9,687,653 | 9,919,945 |
| Michigan | 9,883,640 | 9,883,360 |
| North Carolina | 9,535,483 | 9,752,073 |
| New Jersey | 8,791,894 | 8,864,590 |
| Virginia | 8,001,024 | 8,185,867 |
| Washington | 6,724,540 | 6,897,012 |
| Massachusetts | 6,547,629 | 6,646,144 |
| Arizona | 6,392,017 | 6,553,255 |
| Indiana | 6,483,802 | 6,537,334 |
| Tennessee | 6,346,105 | 6,456,243 |
| Missouri | 5,988,927 | 6,021,988 |
| Maryland | 5,773,552 | 5,884,563 |
| Wisconsin | 5,686,986 | 5,726,398 |
| Minnesota | 5,303,925 | 5,379,139 |
| Colorado | 5,029,196 | 5,187,582 |
| Alabama | 4,779,736 | 4,822,023 |
| South Carolina | 4,625,364 | 4,723,723 |
| Louisiana | 4,533,372 | 4,601,893 |
| Kentucky | 4,339,367 | 4,380,415 |
| Oregon | 3,831,074 | 3,899,353 |
| Oklahoma | 3,751,351 | 3,814,820 |
| Puerto Rico | 3,725,789 | 3,667,084 |
| Connecticut | 3,574,097 | 3,590,347 |
| Iowa | 3,046,355 | 3,074,186 |
| Mississippi | 2,967,297 | 2,984,926 |
| Arkansas | 2,915,918 | 2,949,131 |
| Kansas | 2,853,118 | 2,885,905 |
| Utah | 2,763,885 | 2,855,287 |
| Nevada | 2,700,551 | 2,758,931 |
| New Mexico | 2,059,179 | 2,085,538 |
| Nebraska | 1,826,341 | 1,855,525 |
| West Virginia | 1,852,994 | 1,855,413 |
| Idaho | 1,567,582 | 1,595,728 |
| Hawaii | 1,360,301 | 1,392,313 |
| Maine | 1,328,361 | 1,329,192 |
| New Hampshire | 1,316,470 | 1,320,718 |
| Rhode Island | 1,052,567 | 1,050,292 |
| Montana | 989,415 | 1,005,141 |
| Delaware | 897,934 | 917,092 |
| South Dakota | 814,180 | 833,354 |
| Alaska | 710,231 | 731,449 |
| North Dakota | 672,591 | 699,628 |
| District of Columbia | 601,723 | 632,323 |
| Vermont | 625,741 | 626,011 |
| Wyoming | 563,626 | 576,412 |
_______________
Click images to enlarge. Click your back arrow to return to Dilemma X


_______________
Some large counties in the Southern states
Alabama
Jefferson County 660,009
Mobile County 413,936
Madison County 343,080
Montgomery County 230,149
Shelby County 200,941
Tuscaloosa County 198,596
Baldwin County 190,790
District of Columbia
Washington (City) 632,323
Florida
Miami-Dade County 2,591,035
Broward County 1,815,137
Palm Beach County 1,356,545
Hillsborough County 1,277,746
Orange County 1,202,234
Pinellas County 921,319
Duval County 879,602
Lee County 645,293
Brevard County 547,307
Georgia
Fulton County 977,773
Gwinnett County 842,046
Cobb County 707,442
DeKalb County 707,089
Chatham County 276,434
Clayton County 265,888
Henry County 209,053
Richmond County 202,587
Muscogee County 198,413
Forsyth County 187,928
Bibb County 156,462
Louisiana
East Baton Rouge Parish 444,526
Jefferson Parish 433,676
Orleans Parish 369,250
Caddo Parish 257,093
St. Tammany Parish 239,453
Lafayette Parish 227,055
Maryland
Montgomery County 1,004,709
Prince George’s County 881,138
Baltimore County 817,455
Baltimore City 621,342
Anne Arundel County 550,488
Howard County 299,430
North Carolina
Mecklenburg County 969,031
Wake County 952,151
Guilford County 500,879
Forsyth County 358,137
Cumberland County 324,049
Durham County 279,641
Buncombe County 244,490
New Hanover County 209,234
Union County 208,520
Gaston County 208,049
Cabarrus County 184,498
Johnston County 174,938
South Carolina
Greenville County 467,605
Richland County 393,830
Charleston County 365,162
Spartanburg County 288,745
Horry County 282,285
Lexington County 270,406
York County 234,635
Tennessee
Shelby County 940,764
Davidson County 648,295
Knox County 441,311
Hamilton County 345,545
Texas
Harris County 4,253,700
Dallas County 2,453,843
Tarrant County 1,880,153
Bexar County 1,785,704
Travis County 1,095,584
Collin County 834,642
El Paso County 827,398
Hidalgo County 806,552
Denton County 707,304
Fort Bend County 627,293
Virginia
Fairfax County 1,118,602
Prince William County 430,289
Loudoun County 336,898
Chesterfield County 323,856
Henrico County 314,932
Norfolk (City) 245,782
Arlington County 221,045
Virginia Beach (City) 447,021
____________
Click images to enlarge. Click your back arrow to return to Dilemma X


______________________
Video: Mayor Bloomberg announces more people moving in to New York City than moving out
______________________
Video: Census in the Constitution
______________________
Video: The 1940 Census of Population
________________________
See link to: U.S. state population estimates released for 2013
The latest estimates of total population for the United States, States, and Puerto Rico Commonwealth – for July 1, 2013 – were released December 30, 2013
https://dilemma-x.net/2014/01/02/u-s-state-population-estimates-released-for-2013/


March 14, 2013 at 5:19 pm
Reblogged this on The ObamaCrat.Com™ and commented:
Vitally important Census information that very well might impact the 2014 election. Thank you Dilemma X.