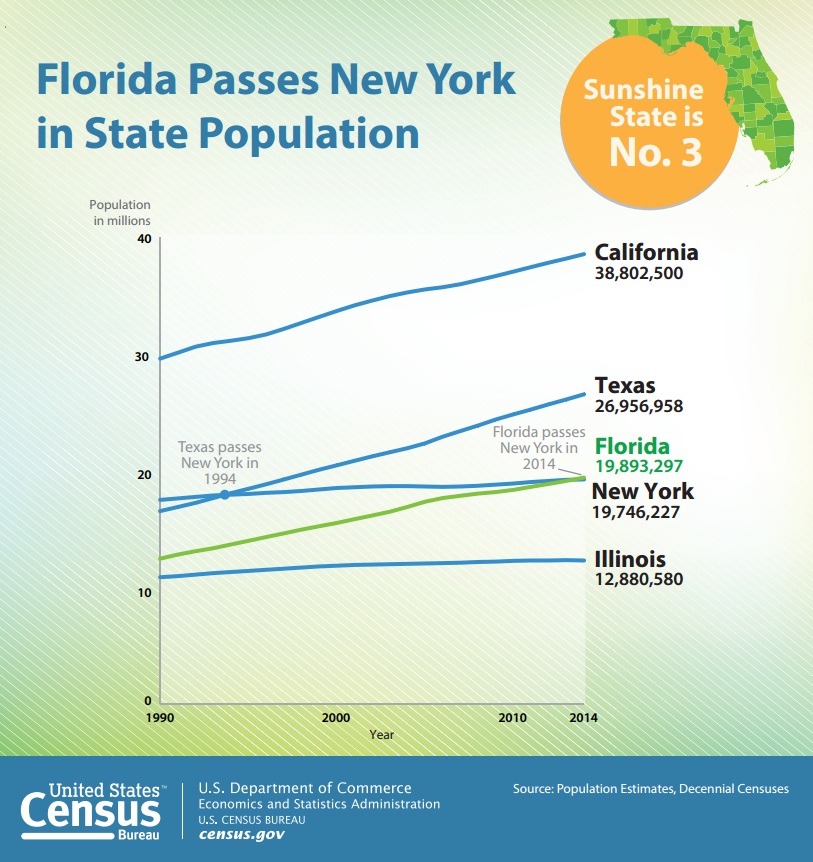
Florida passes New York and North Carolina passes Michigan in population

Release Date: DECEMBER 23, 2014
U.S. Census Bureau
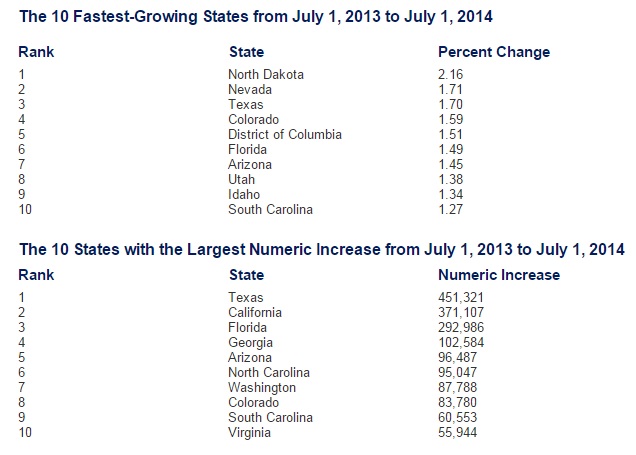
By adding an average of 803 new residents each day between July 1, 2013 and July 1, 2014, Florida passed New York to become the nation’s third most populous state, according to U.S. Census Bureau state population estimates released today. Florida’s population grew by 293,000 over this period, reaching 19.9 million. The population of New York increased by 51,000 to 19.7 million.
California remained the nation’s most populous state in 2014, with 38.8 million residents, followed by Texas, at 27.0 million.
Although the list of the 10 most populous states overall was unchanged, two other states did change positions, as North Carolina moved past Michigan to take the ninth spot. That pushed the state’s total estimated population to just shy of 10 million.
Another milestone took place in Georgia (ranked 8th), which saw its population surpass 10 million for the first time.
North Dakota was the nation’s fastest-growing state over the last year. Its population increased 2.2 percent, followed by the 1.7 percent growth in Nevada and Texas. Each of the 10 fastest-growing states was in the South or West with the exception of North Dakota.
Six states lost population between July 1, 2013, and July 1, 2014:
Illinois (9,972 or -0.08 percent)
West Virginia (3,269 or -0.18 percent)
Connecticut (2,664 or -0.07 percent)
New Mexico (1,323 or -0.06 percent
Alaska (527 or -0.07 percent)
Vermont (293 or -0.05 percent)
The United States as a whole saw its population increase by 2.4 million to 318.9 million, or 0.75 percent.
In addition to the 50 states and the District of Columbia, the new statistics also include estimates for Puerto Rico. On July 1, 2014, Puerto Rico had an estimated population of 3.5 million, a decline of 47,000, or 1.3 percent, from one year earlier.
The Census Bureau produces population estimates each year, allowing the public to gauge the growth and demographic composition of the nation, states and communities. These statistics use administrative data to estimate population change between census years, using the decennial census count as a starting point. Local governments use estimates to locate services, and estimates are used by the private sector to locate businesses.
___________
| Rank | State | Population |
| 1 | California | 38,802,500 |
| 2 | Texas | 26,956,958 |
| 3 | Florida | 19,893,297 |
| 4 | New York | 19,746,227 |
| 5 | Illinois | 12,880,580 |
| 6 | Pennsylvania | 12,787,209 |
| 7 | Ohio | 11,594,163 |
| 8 | Georgia | 10,097,343 |
| 9 | North Carolina | 9,943,964 |
| 10 | Michigan | 9,909,877 |
___________
__________
__________

__________
| Rank | State | 2014 Population |
| 1 | California | 38,802,500 |
| 2 | Texas | 26,956,958 |
| 3 | Florida | 19,893,297 |
| 4 | New York | 19,746,227 |
| 5 | Illinois | 12,880,580 |
| 6 | Pennsylvania | 12,787,209 |
| 7 | Ohio | 11,594,163 |
| 8 | Georgia | 10,097,343 |
| 9 | North Carolina | 9,943,964 |
| 10 | Michigan | 9,909,877 |
| 11 | New Jersey | 8,938,175 |
| 12 | Virginia | 8,326,289 |
| 13 | Washington | 7,061,530 |
| 14 | Massachusetts | 6,745,408 |
| 15 | Arizona | 6,731,484 |
| 16 | Indiana | 6,596,855 |
| 17 | Tennessee | 6,549,352 |
| 18 | Missouri | 6,063,589 |
| 19 | Maryland | 5,976,407 |
| 20 | Wisconsin | 5,757,564 |
| 21 | Minnesota | 5,457,173 |
| 22 | Colorado | 5,355,866 |
| 23 | Alabama | 4,849,377 |
| 24 | South Carolina | 4,832,482 |
| 25 | Louisiana | 4,649,676 |
| 26 | Kentucky | 4,413,457 |
| 27 | Oregon | 3,970,239 |
| 28 | Oklahoma | 3,878,051 |
| 29 | Connecticut | 3,596,677 |
| Puerto Rico | 3,548,397 | |
| 30 | Iowa | 3,107,126 |
| 31 | Mississippi | 2,994,079 |
| 32 | Arkansas | 2,966,369 |
| 33 | Utah | 2,942,902 |
| 34 | Kansas | 2,904,021 |
| 35 | Nevada | 2,839,099 |
| 36 | New Mexico | 2,085,572 |
| 37 | Nebraska | 1,881,503 |
| 38 | West Virginia | 1,850,326 |
| 39 | Idaho | 1,634,464 |
| 40 | Hawaii | 1,419,561 |
| 41 | Maine | 1,330,089 |
| 42 | New Hampshire | 1,326,813 |
| 43 | Rhode Island | 1,055,173 |
| 44 | Montana | 1,023,579 |
| 45 | Delaware | 935,614 |
| 46 | South Dakota | 853,175 |
| 47 | North Dakota | 739,482 |
| 48 | Alaska | 736,732 |
| District of Columbia | 658,893 | |
| 49 | Vermont | 626,562 |
| 50 | Wyoming | 584,153 |
__________
__________

| State | Census 2010 | 2014 | Growth | Percent |
| Alabama | 4,780,127 | 4,849,377 | 69,250 | 1.4 |
| Alaska | 710,249 | 736,732 | 26,483 | 3.7 |
| Arizona | 6,392,310 | 6,731,484 | 339,174 | 5.3 |
| Arkansas | 2,915,958 | 2,966,369 | 50,411 | 1.7 |
| California | 37,254,503 | 38,802,500 | 1,547,997 | 4.2 |
| Colorado | 5,029,324 | 5,355,866 | 326,542 | 6.5 |
| Connecticut | 3,574,096 | 3,596,677 | 22,581 | 0.6 |
| Delaware | 897,936 | 935,614 | 37,678 | 4.2 |
| District of Columbia | 601,767 | 658,893 | 57,126 | 9.5 |
| Florida | 18,804,623 | 19,893,297 | 1,088,674 | 5.8 |
| Georgia | 9,688,681 | 10,097,343 | 408,662 | 4.2 |
| Hawaii | 1,360,301 | 1,419,561 | 59,260 | 4.4 |
| Idaho | 1,567,652 | 1,634,464 | 66,812 | 4.3 |
| Illinois | 12,831,587 | 12,880,580 | 48,993 | 0.4 |
| Indiana | 6,484,192 | 6,596,855 | 112,663 | 1.7 |
| Iowa | 3,046,869 | 3,107,126 | 60,257 | 2 |
| Kansas | 2,853,132 | 2,904,021 | 50,889 | 1.8 |
| Kentucky | 4,339,349 | 4,413,457 | 74,108 | 1.7 |
| Louisiana | 4,533,479 | 4,649,676 | 116,197 | 2.6 |
| Maine | 1,328,361 | 1,330,089 | 1,728 | 0.1 |
| Maryland | 5,773,785 | 5,976,407 | 202,622 | 3.5 |
| Massachusetts | 6,547,817 | 6,745,408 | 197,591 | 3 |
| Michigan | 9,884,133 | 9,909,877 | 25,744 | 0.3 |
| Minnesota | 5,303,925 | 5,457,173 | 153,248 | 2.9 |
| Mississippi | 2,968,103 | 2,994,079 | 25,976 | 0.9 |
| Missouri | 5,988,923 | 6,063,589 | 74,666 | 1.2 |
| Montana | 989,417 | 1,023,579 | 34,162 | 3.5 |
| Nebraska | 1,826,341 | 1,881,503 | 55,162 | 3 |
| Nevada | 2,700,692 | 2,839,099 | 138,407 | 5.1 |
| New Hampshire | 1,316,466 | 1,326,813 | 10,347 | 0.8 |
| New Jersey | 8,791,936 | 8,938,175 | 146,239 | 1.7 |
| New Mexico | 2,059,192 | 2,085,572 | 26,380 | 1.3 |
| New York | 19,378,112 | 19,746,227 | 368,115 | 1.9 |
| North Carolina | 9,535,691 | 9,943,964 | 408,273 | 4.3 |
| North Dakota | 672,591 | 739,482 | 66,891 | 9.9 |
| Ohio | 11,536,725 | 11,594,163 | 57,438 | 0.5 |
| Oklahoma | 3,751,616 | 3,878,051 | 126,435 | 3.4 |
| Oregon | 3,831,073 | 3,970,239 | 139,166 | 3.6 |
| Pennsylvania | 12,702,884 | 12,787,209 | 84,325 | 0.7 |
| Rhode Island | 1,052,931 | 1,055,173 | 2,242 | 0.2 |
| South Carolina | 4,625,401 | 4,832,482 | 207,081 | 4.5 |
| South Dakota | 814,191 | 853,175 | 38,984 | 4.8 |
| Tennessee | 6,346,275 | 6,549,352 | 203,077 | 3.2 |
| Texas | 25,146,104 | 26,956,958 | 1,810,854 | 7.2 |
| Utah | 2,763,885 | 2,942,902 | 179,017 | 6.5 |
| Vermont | 625,745 | 626,562 | 817 | 0.1 |
| Virginia | 8,001,023 | 8,326,289 | 325,266 | 4.1 |
| Washington | 6,724,543 | 7,061,530 | 336,987 | 5 |
| West Virginia | 1,853,033 | 1,850,326 | -2,707 | -0.1 |
| Wisconsin | 5,687,289 | 5,757,564 | 70,275 | 1.2 |
| Wyoming | 563,767 | 584,153 | 20,386 | 3.6 |
| Puerto Rico | 3,726,157 | 3,548,397 | -177,760 | -4.8 |
| Source: U.S. Census Bureau, Population Division | ||||
__________
1970 Population
| Rank | State | 1970 Population |
| 1 | California | 19,971,069 |
| 2 | New York | 18,241,266 |
| 3 | Pennsylvania | 11,793,909 |
| 4 | Texas | 11,196,730 |
| 5 | Illinois | 11,113,976 |
| 6 | Ohio | 10,652,017 |
| 7 | Michigan | 8,875,083 |
| 8 | New Jersey | 7,168,164 |
| 9 | Florida | 6,789,443 |
| 10 | Massachusetts | 5,689,170 |
| 11 | Indiana | 5,193,669 |
| 12 | North Carolina | 5,082,059 |
| 13 | Missouri | 4,677,399 |
| 14 | Virginia | 4,648,494 |
| 15 | Georgia | 4,589,575 |
| 16 | Wisconsin | 4,417,933 |
| 17 | Tennessee | 3,924,164 |
| 18 | Maryland | 3,922,399 |
| 19 | Minnesota | 3,805,069 |
| 20 | Louisiana | 3,643,180 |
| 21 | Alabama | 3,444,165 |
| 22 | Washington | 3,409,169 |
| 23 | Kentucky | 3,219,311 |
| 24 | Connecticut | 3,032,217 |
| 25 | Iowa | 2,825,041 |
| 26 | South Carolina | 2,590,516 |
| 27 | Oklahoma | 2,559,253 |
| 28 | Kansas | 2,249,071 |
| 29 | Mississippi | 2,216,912 |
| 30 | Colorado | 2,207,259 |
| 31 | Oregon | 2,091,385 |
| 32 | Arkansas | 1,923,295 |
| 33 | Arizona | 1,772,482 |
| 34 | West Virginia | 1,744,237 |
| 35 | Nebraska | 1,483,791 |
| 36 | Utah | 1,059,273 |
| 37 | New Mexico | 1,016,000 |
| 38 | Maine | 993,663 |
| 39 | Rhode Island | 949,723 |
| 40 | Hawaii | 769,913 |
| District of Columbia | 756,510 | |
| 41 | New Hampshire | 737,681 |
| 42 | Idaho | 713,008 |
| 43 | Montana | 694,409 |
| 44 | South Dakota | 666,257 |
| 45 | North Dakota | 617,761 |
| 46 | Delaware | 548,104 |
| 47 | Nevada | 488,738 |
| 48 | Vermont | 444,732 |
| 49 | Wyoming | 332,416 |
| 50 | Alaska | 302,173 |
| Puerto Rico | 2,712,033 |
_________


December 24, 2014
Did you know?