2017 U.S. Census Bureau metropolitan population estimates –Release Date: March 22, 2018
U.S. Census Bureau metropolitan population estimates July 1, 2017 –Release Date: March 22, 2018
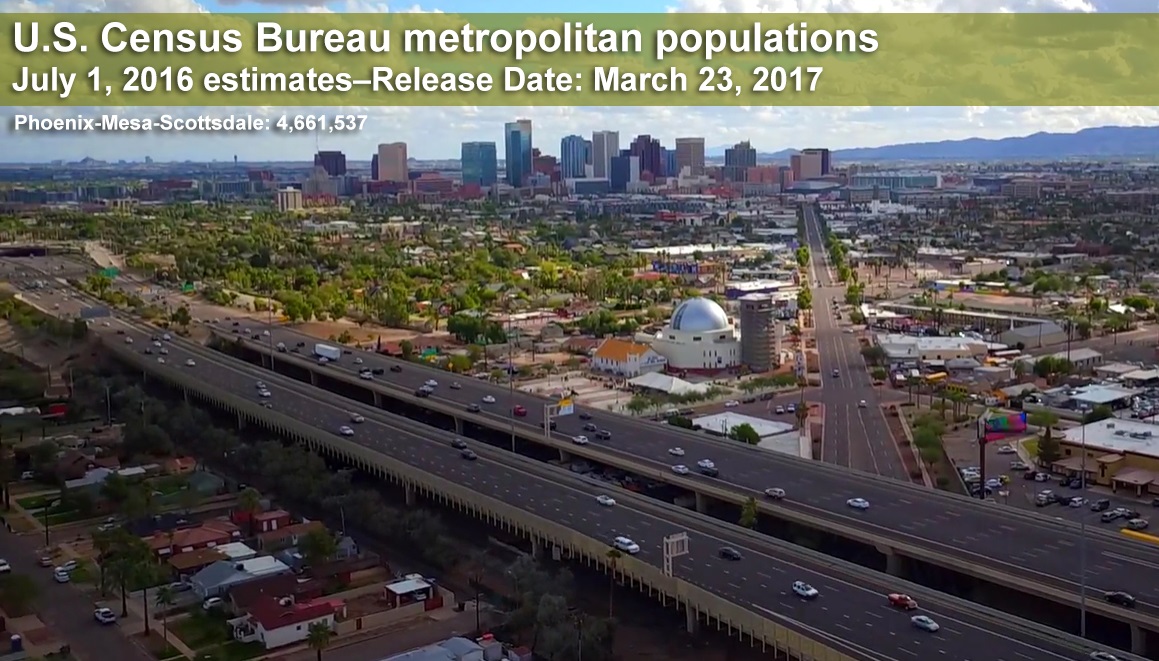
U.S. Census Bureau metropolitan population estimates July 1, 2016 –Release Date: March 23, 2017
Source: U.S. Census Bureau
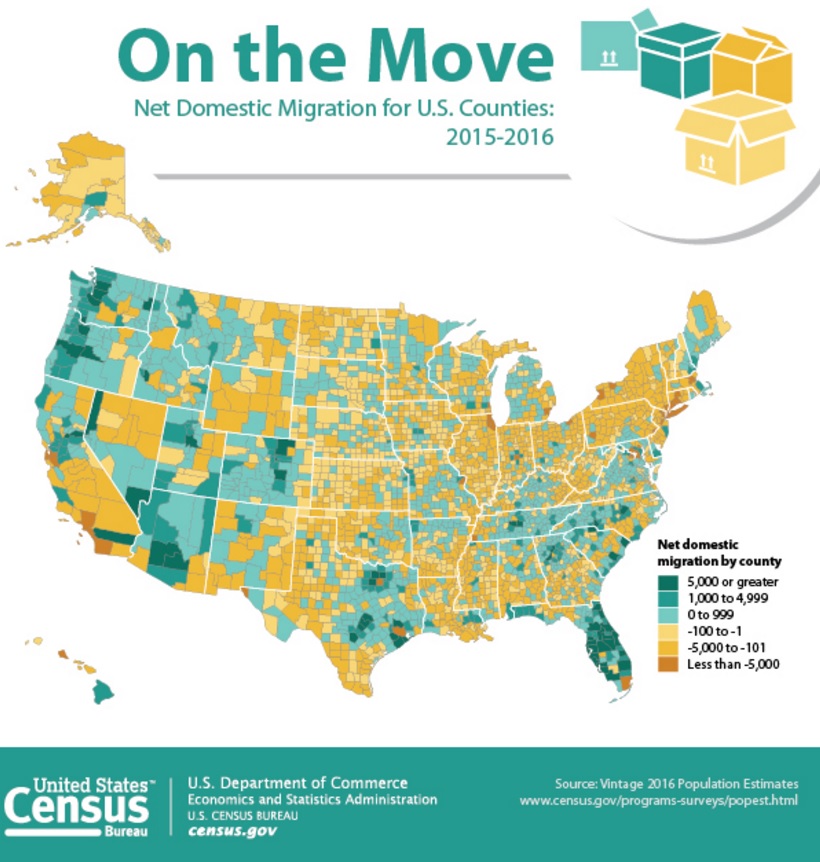
Maricopa County, Ariz., replaced Harris County, Texas, as the county with the nation’s highest annual population growth, according to U.S. Census Bureau population estimates released today. Harris County was the largest numeric gainer for eight years in a row. Maricopa County gained 81,360 people between July 1, 2015 and July 1, 2016, or about 222 people per day, while the nation’s second-largest population gainer, Harris County, gained 56,587 people, or about 155 people per day on average.
Maricopa County, home to Phoenix, primarily grew through the addition of 43,189 residents from net domestic migration, a measure of how many people move to or from an area versus other parts of the United States. The county also added 25,428 people from natural increase (more births than deaths) and 10,188 people from net international migration.
Harris County, Texas, home to Houston, saw changes in net domestic migration, going from a net gain of more than 17,000 to a net loss of more than 16,000. Despite this, Harris County had the second largest gain in population due to high natural increase (46,412) and net international migration (27,922).
“In the early 2000s, Maricopa County was in the top one or two counties by numeric growth. From 2009-2011, Maricopa County saw much lower net migration than in the years before or after, which caused the county to drop out of the top population-gaining counties,” explained Peter Borsella, a demographer in the Census Bureau’s population division. “While net international migration has not reached prior levels, net domestic migration and natural increase have continued to rise, making Maricopa County this year’s largest numeric gainer.”
In addition, Maricopa grew the fastest among the top 10 largest counties at 1.95 percent, an increase from 1.90 percent from the previous year. Harris County remained the third-largest county with 4.6 million people, and Maricopa County remained the fourth-largest county with 4.2 million people. Los Angeles County and Cook County, Ill., remained the largest and second-largest counties, respectively.
The statistics released today provide population estimates and components of change for our nation’s 382 metropolitan statistical areas, 551 micropolitan statistical areas, and 3,142 counties, as well as Puerto Rico’s metropolitan statistical areas, micropolitan statistical areas and municipios.
Find more highlights from this year’s release below and local-level statistics on census.gov.
In the coming months, the Census Bureau will release 2016 population estimates for cities and towns, as well as national, state and county population estimates by age, sex, race and Hispanic origin.
Some High-Population Counties or County-Equivalents Continued to Experience Population Loss
Top 10 Largest-Gaining Counties (Numeric Change): July 1, 2015 to July 1, 2016
| County | Population | Numeric Change | Percent Change |
| Maricopa County, Arizona | 4,242,997 | 81,360 | 1.95 |
| Harris County, Texas | 4,589,928 | 56,587 | 1.25 |
| Clark County, Nevada | 2,155,664 | 46,375 | 2.2 |
| King County, Washington | 2,149,970 | 35,714 | 1.69 |
| Tarrant County, Texas | 2,016,872 | 35,462 | 1.79 |
| Riverside County, California | 2,387,741 | 34,849 | 1.48 |
| Bexar County, Texas | 1,928,680 | 33,198 | 1.75 |
| Orange County, Florida | 1,314,367 | 29,503 | 2.3 |
| Dallas County, Texas | 2,574,984 | 29,209 | 1.15 |
| Hillsborough County, Florida | 1,376,238 | 29,161 | 2.16 |
________
Top 10 Largest-Declining Counties or County Equivalents (Numeric Change): July 1, 2015 to July 1, 2016
| Geography | July 1, 2016 Population Estimate |
| New York-Newark, NY-NJ-CT-PA CSA | 23,689,255 |
| Los Angeles-Long Beach, CA CSA | 18,688,022 |
| Chicago-Naperville, IL-IN-WI CSA | 9,882,634 |
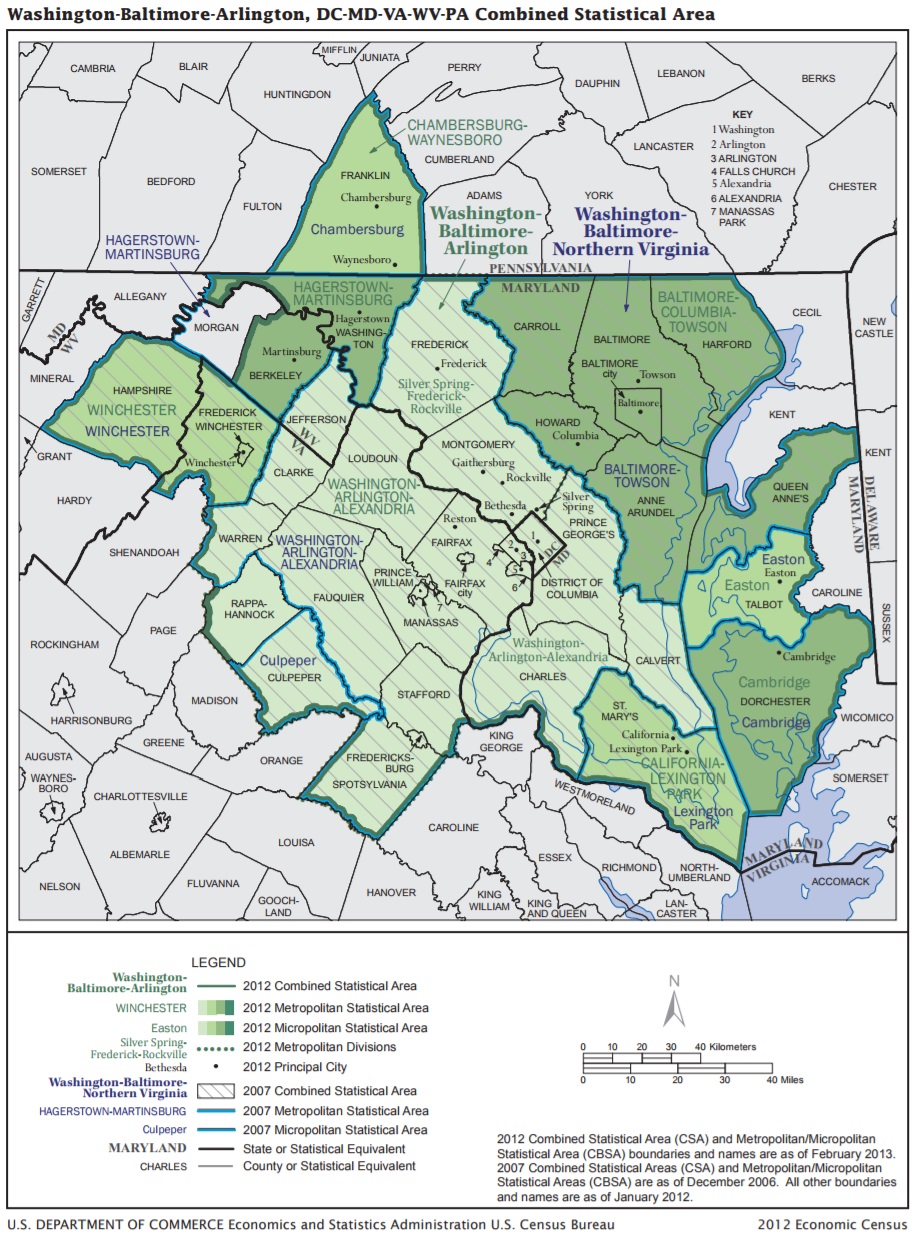
| Washington-Baltimore-Arlington, DC-MD-VA-WV-PA CSA | 9,665,892 |
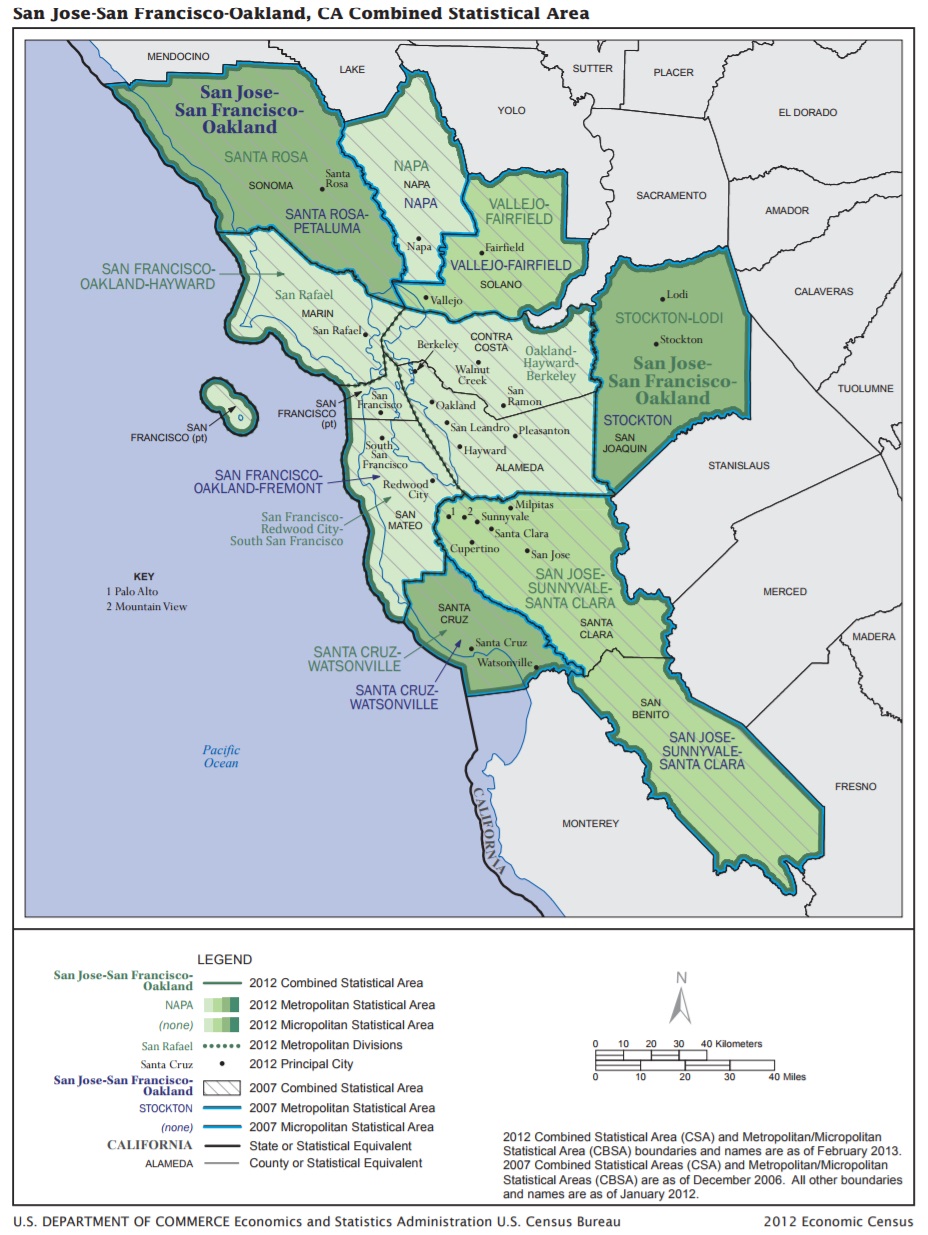
| San Jose-San Francisco-Oakland, CA CSA | 8,751,807 |
| Boston-Worcester-Providence, MA-RI-NH-CT CSA | 8,176,376 |
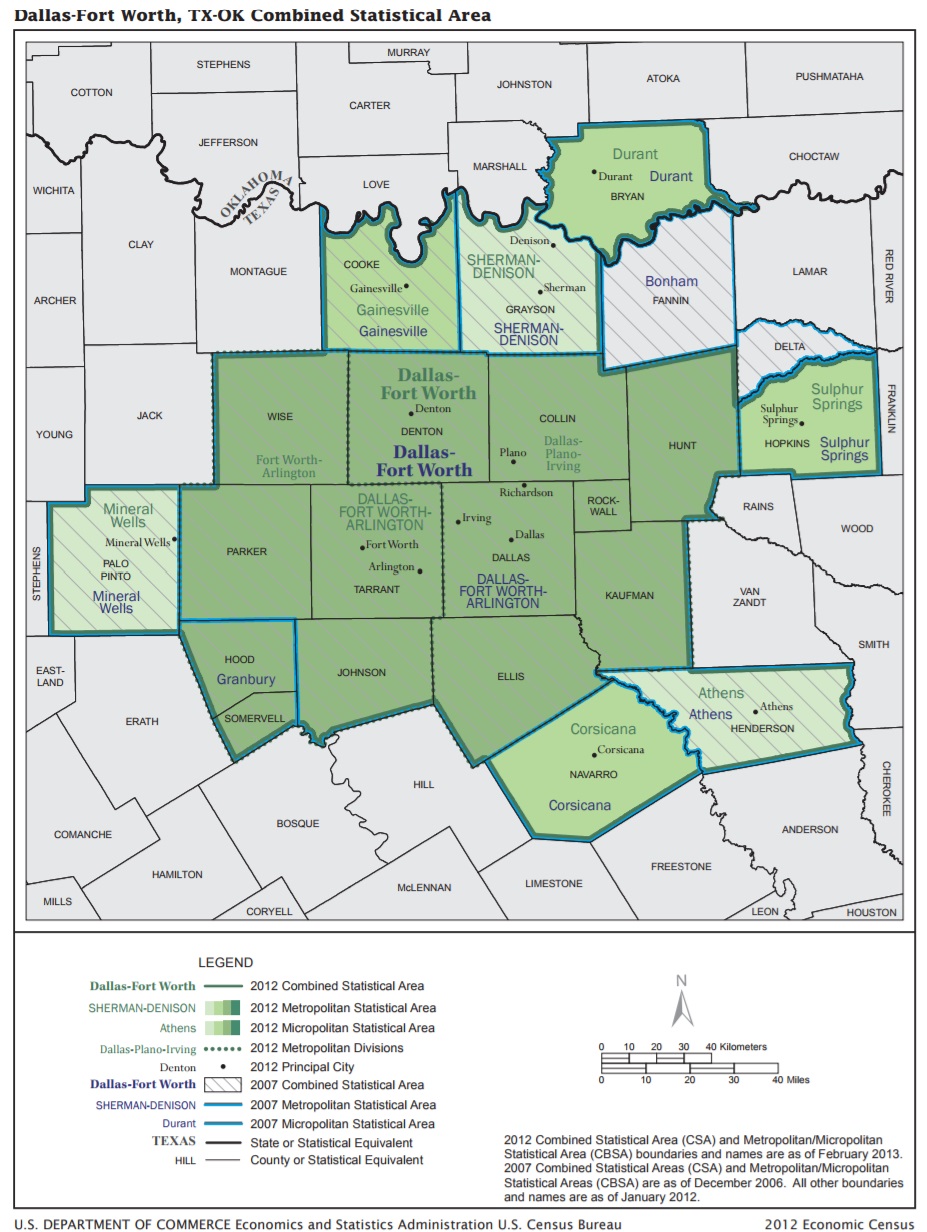
| Dallas-Fort Worth, TX-OK CSA | 7,673,305 |
| Philadelphia-Reading-Camden, PA-NJ-DE-MD CSA | 7,179,357 |
| Houston-The Woodlands, TX CSA | 6,972,374 |
| Miami-Fort Lauderdale-Port St. Lucie, FL CSA | 6,723,472 |
| Atlanta–Athens-Clarke County–Sandy Springs, GA CSA | 6,451,262 |
| Detroit-Warren-Ann Arbor, MI CSA | 5,318,653 |
| Seattle-Tacoma, WA CSA | 4,684,516 |
| Phoenix-Mesa-Scottsdale, AZ Metro Area | 4,661,537 |
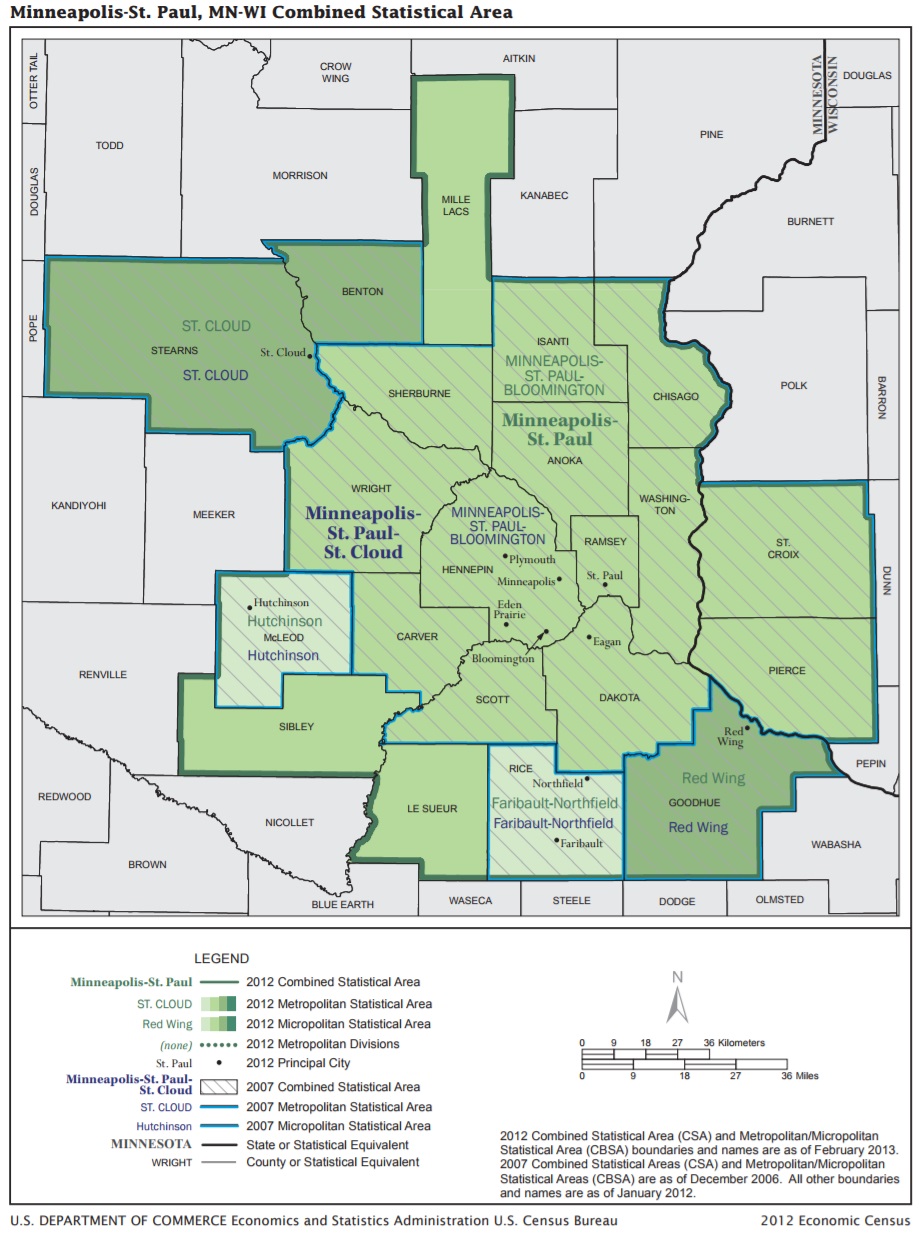
| Minneapolis-St. Paul, MN-WI CSA | 3,894,820 |
| Cleveland-Akron-Canton, OH CSA | 3,483,311 |
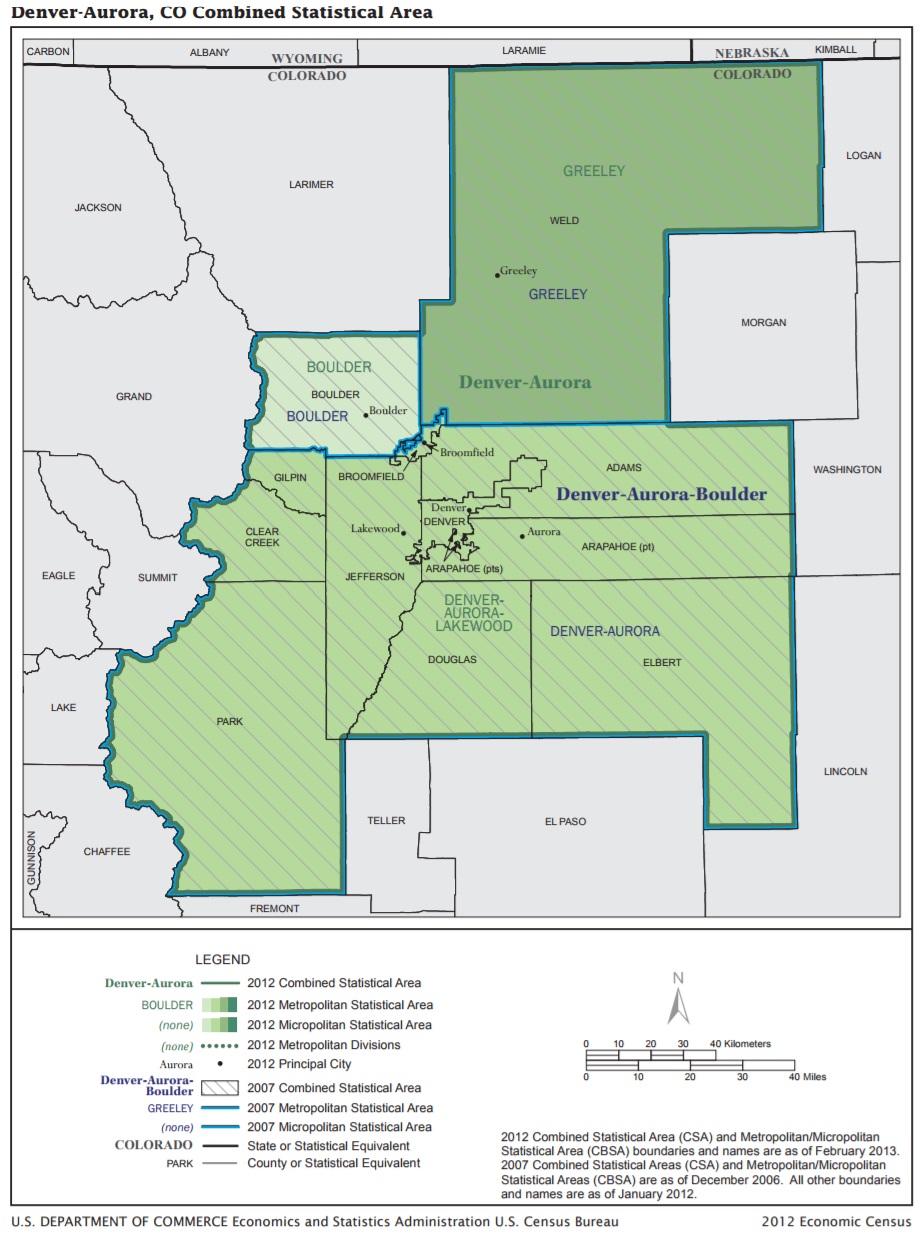
| Denver-Aurora, CO CSA | 3,470,235 |
| San Diego-Carlsbad, CA Metro Area | 3,317,749 |
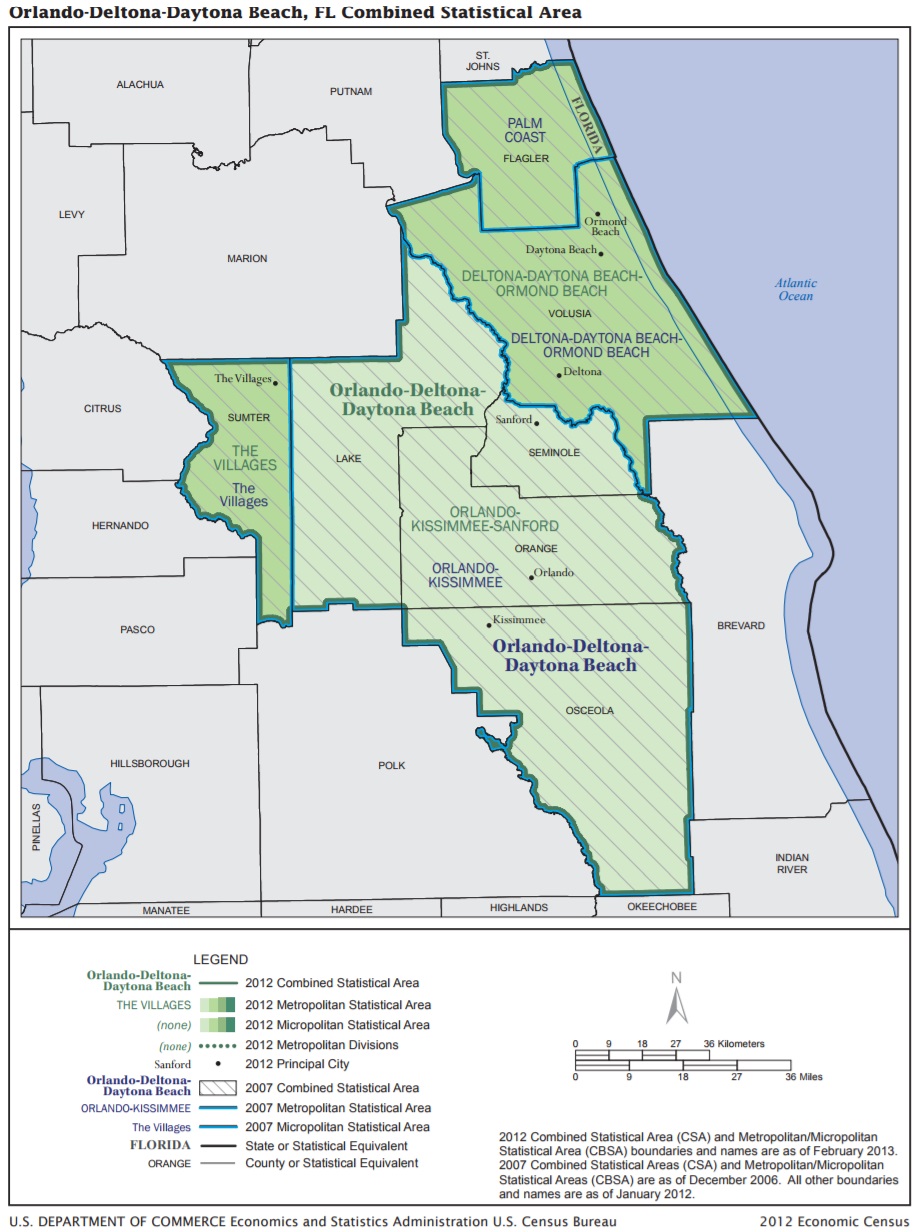
| Orlando-Deltona-Daytona Beach, FL CSA | 3,202,927 |
| Portland-Vancouver-Salem, OR-WA CSA | 3,160,488 |
| Tampa-St. Petersburg-Clearwater, FL Metro Area | 3,032,171 |
| St. Louis-St. Charles-Farmington, MO-IL CSA | 2,911,769 |
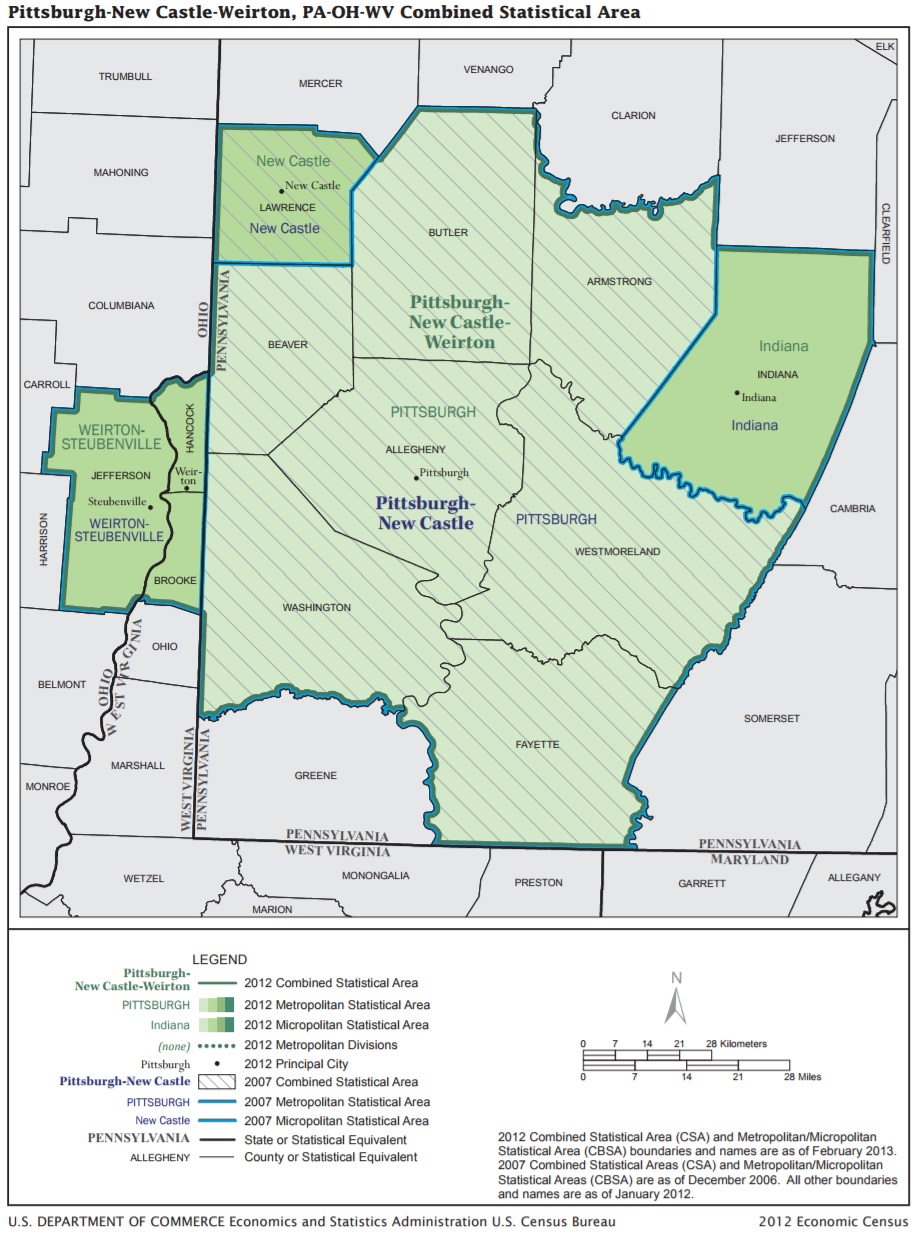
| Pittsburgh-New Castle-Weirton, PA-OH-WV CSA | 2,635,228 |
| Charlotte-Concord, NC-SC CSA | 2,632,249 |
| Sacramento-Roseville, CA CSA | 2,567,451 |
| Salt Lake City-Provo-Orem, UT CSA | 2,514,748 |
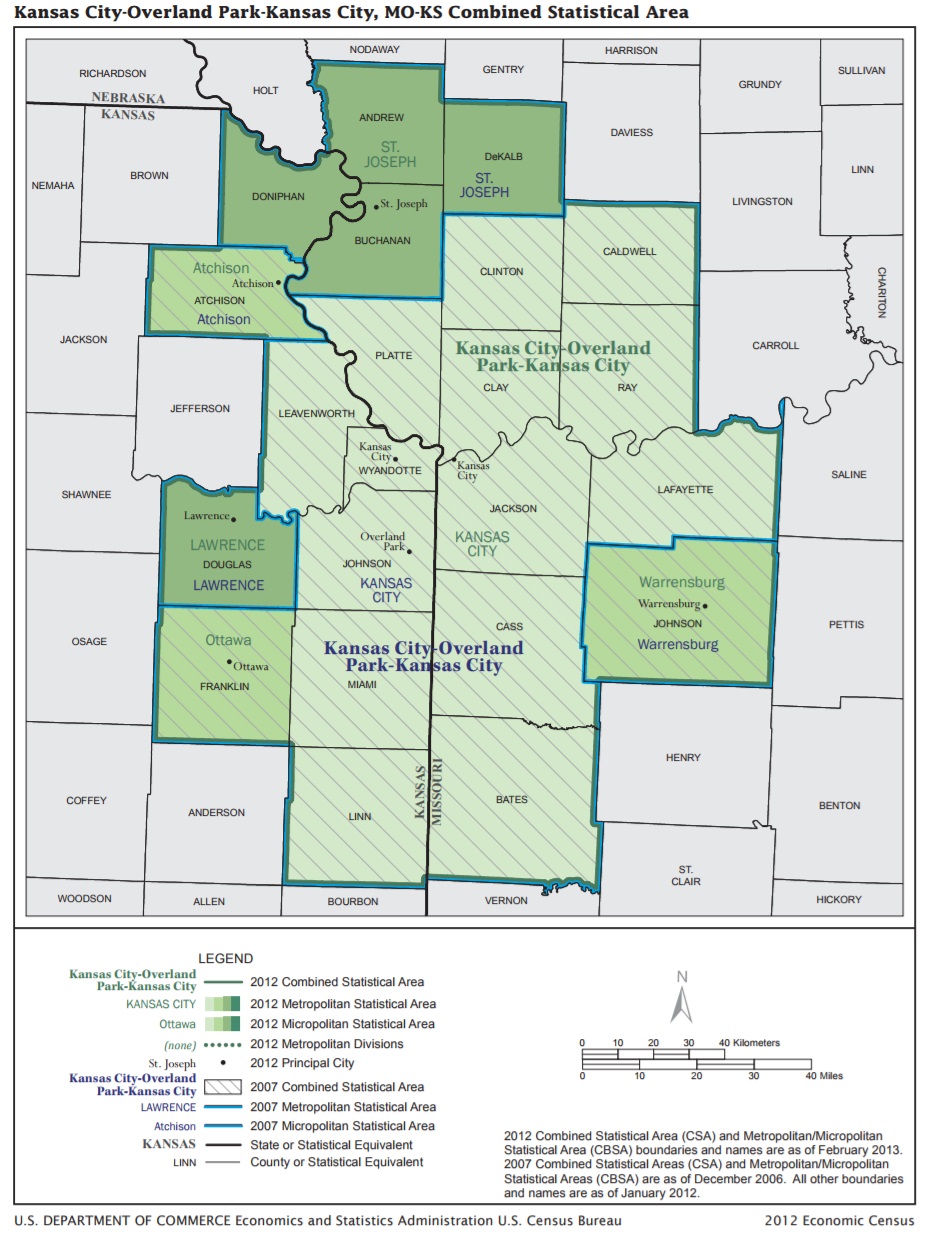
| Kansas City-Overland Park-Kansas City, MO-KS CSA | 2,446,396 |
| Columbus-Marion-Zanesville, OH CSA | 2,443,402 |
| San Antonio-New Braunfels, TX Metro Area | 2,429,609 |
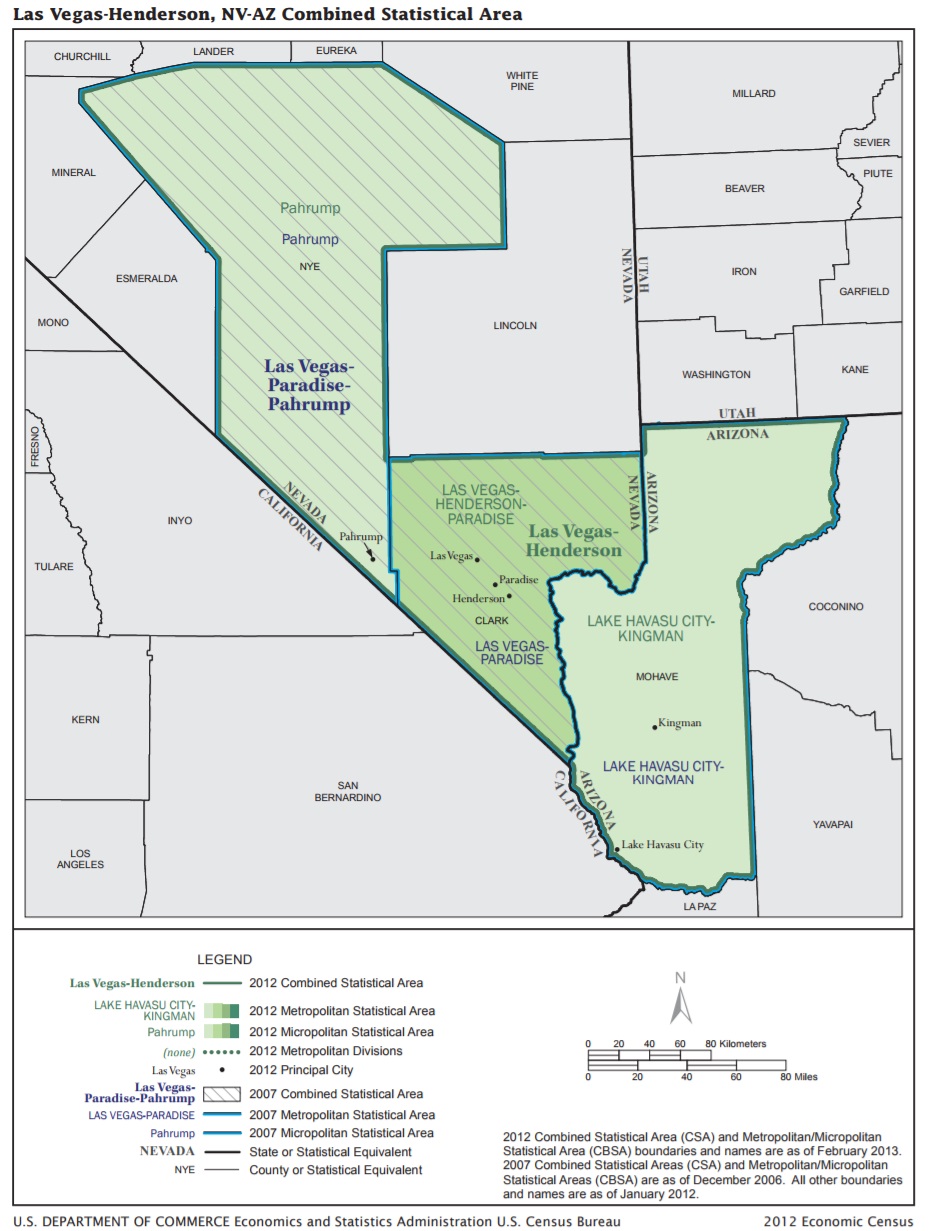
| Las Vegas-Henderson, NV-AZ CSA | 2,404,336 |
| Indianapolis-Carmel-Muncie, IN CSA | 2,386,199 |
| Cincinnati-Wilmington-Maysville, OH-KY-IN CSA | 2,224,231 |
| Raleigh-Durham-Chapel Hill, NC CSA | 2,156,253 |
| Austin-Round Rock, TX Metro Area | 2,056,405 |
| Milwaukee-Racine-Waukesha, WI CSA | 2,043,274 |
| Nashville-Davidson–Murfreesboro, TN CSA | 1,987,778 |
| Virginia Beach-Norfolk, VA-NC CSA | 1,830,629 |
| Greensboro–Winston-Salem–High Point, NC CSA | 1,650,019 |
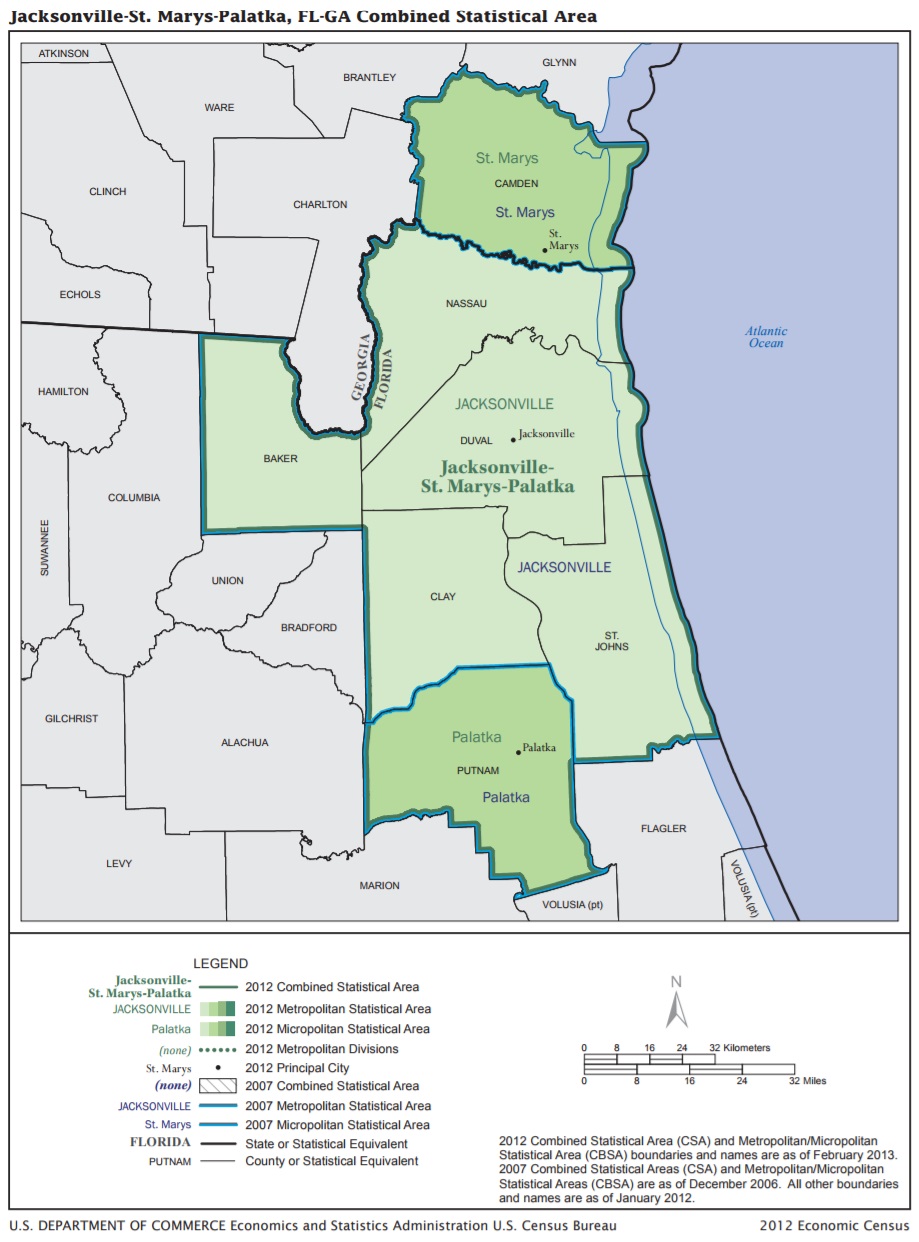
| Jacksonville-St. Marys-Palatka, FL-GA CSA | 1,603,497 |
| Louisville/Jefferson County–Elizabethtown–Madison, KY-IN CSA | 1,510,945 |
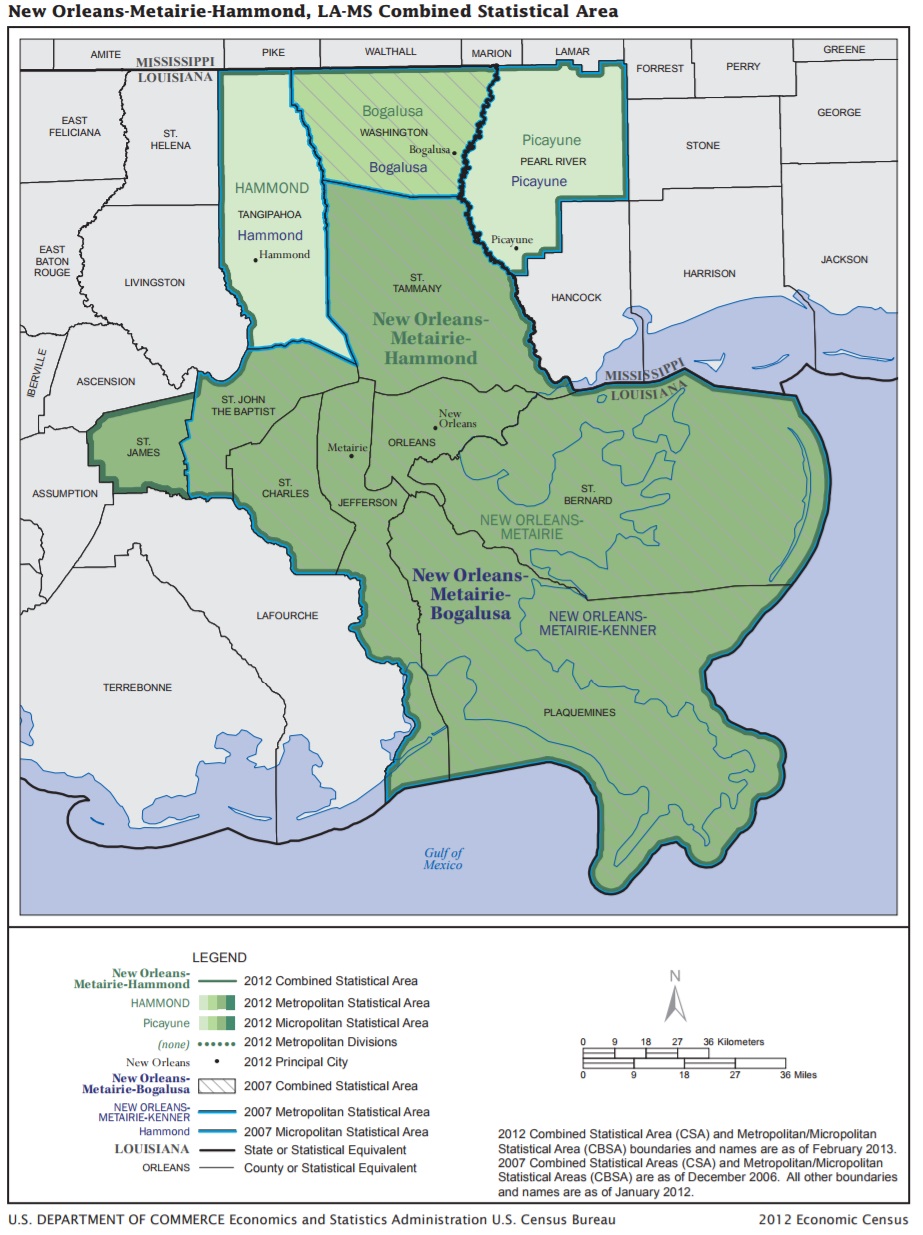
| New Orleans-Metairie-Hammond, LA-MS CSA | 1,501,213 |
| Hartford-West Hartford, CT CSA | 1,476,637 |
| Oklahoma City-Shawnee, OK CSA | 1,445,501 |
| Grand Rapids-Wyoming-Muskegon, MI CSA | 1,443,508 |
| Greenville-Spartanburg-Anderson, SC CSA | 1,442,117 |
| Memphis-Forrest City, TN-MS-AR CSA | 1,369,038 |
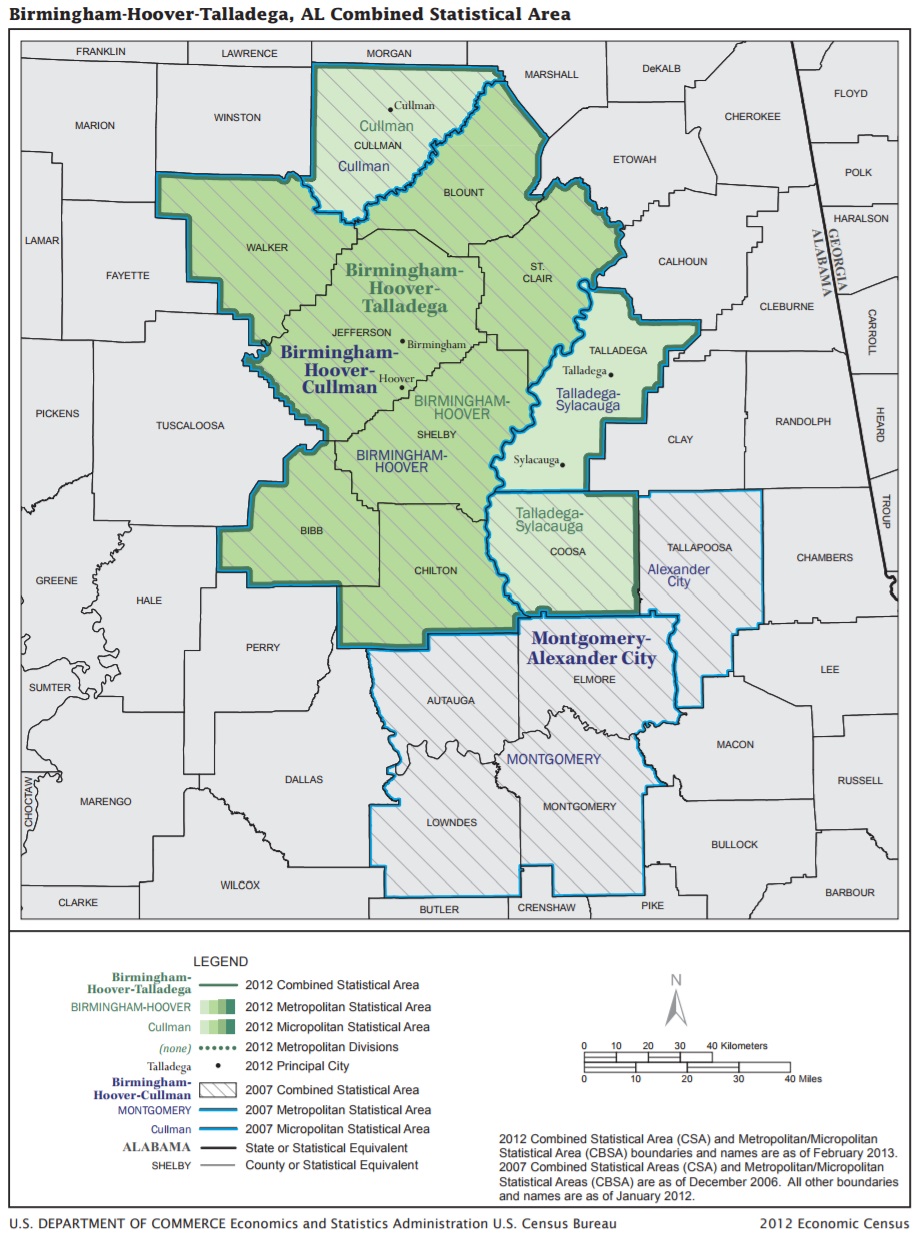
| Birmingham-Hoover-Talladega, AL CSA | 1,361,299 |
| Richmond-Petersburg, VA Metro Area | 1,281,708 |
| Harrisburg-York-Lebanon, PA CSA | 1,252,820 |
| Buffalo-Cheektowaga, NY CSA | 1,210,481 |
| Albany-Schenectady, NY CSA | 1,172,299 |
| Rochester-Batavia-Seneca Falls, NY CSA | 1,172,138 |
| Albuquerque-Santa Fe-Las Vegas, NM CSA | 1,171,991 |
| Tulsa-Muskogee-Bartlesville, OK CSA | 1,157,465 |
| Fresno-Madera, CA CSA | 1,134,612 |
| Knoxville-Morristown-Sevierville, TN CSA | 1,117,758 |
| Cape Coral-Fort Myers-Naples, FL CSA | 1,087,472 |
| Dayton-Springfield-Sidney, OH CSA | 1,074,617 |
| Tucson-Nogales, AZ CSA | 1,062,191 |
| El Paso-Las Cruces, TX-NM CSA | 1,056,178 |
| North Port-Sarasota, FL CSA | 1,002,722 |
| Honolulu, HI MSA | 992,605 |
| Omaha-Council Bluffs-Fremont, NE-IA CSA | 960,886 |
| Chattanooga-Cleveland-Dalton, TN-GA-AL CSA | 954,228 |
| Columbia-Orangeburg-Newberry, SC CSA | 943,470 |
| McAllen-Edinburg, TX CSA | 913,965 |
| Little Rock-North Little Rock, AR CSA | 905,847 |
| Madison-Janesville-Beloit, WI CSA | 874,498 |
| Modesto-Merced, CA CSA | 810,232 |
| Des Moines-Ames-West Des Moines, IA CSA | 795,055 |
| Boise City-Mountain Home-Ontario, ID-OR CSA | 770,906 |
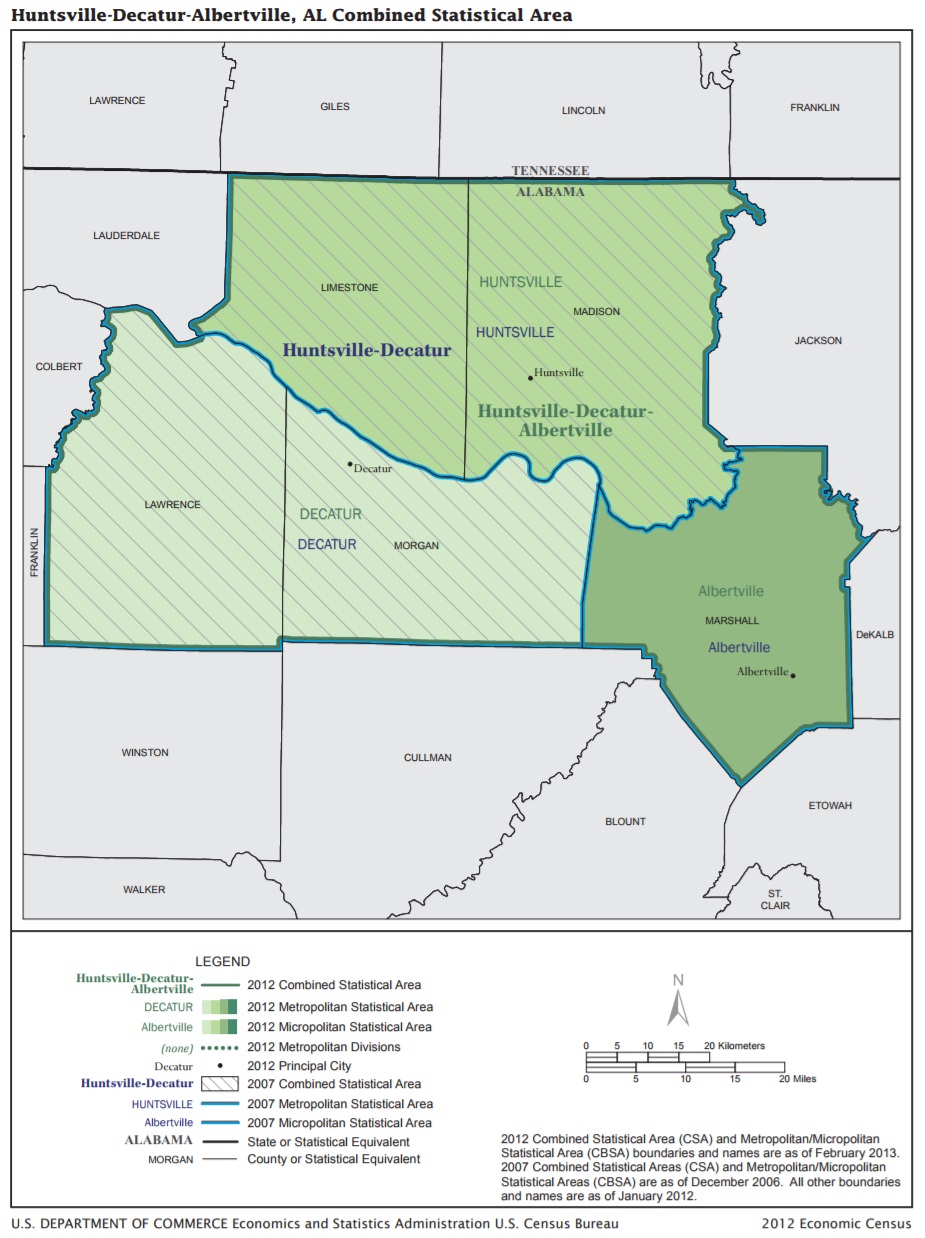
| Huntsville-Decatur-Albertville, AL CSA | 768,033 |
| Syracuse-Auburn, NY CSA | 734,371 |
| Lexington-Fayette–Richmond–Frankfort, KY CSA | 732,372 |
| South Bend-Elkhart-Mishawaka, IN-MI CSA | 725,087 |
| Spokane-Spokane Valley-Coeur d’Alene, WA-ID CSA | 710,945 |
| Springfield-Greenfield Town, MA CSA | 700,665 |
| Charleston-Huntington-Ashland, WV-OH-KY CSA | 687,292 |
| Wichita-Arkansas City-Winfield, KS CSA | 680,425 |
| Jackson-Vicksburg-Brookhaven, MS CSA | 670,031 |
| Youngstown-Warren, OH-PA CSA | 648,431 |
| Toledo-Port Clinton, OH CSA | 645,857 |
| Portland-Lewiston-South Portland, ME CSA | 636,976 |
| Fort Wayne-Huntington-Auburn, IN CSA | 627,934 |
| Lafayette-Opelousas-Morgan City, LA CSA | 627,504 |
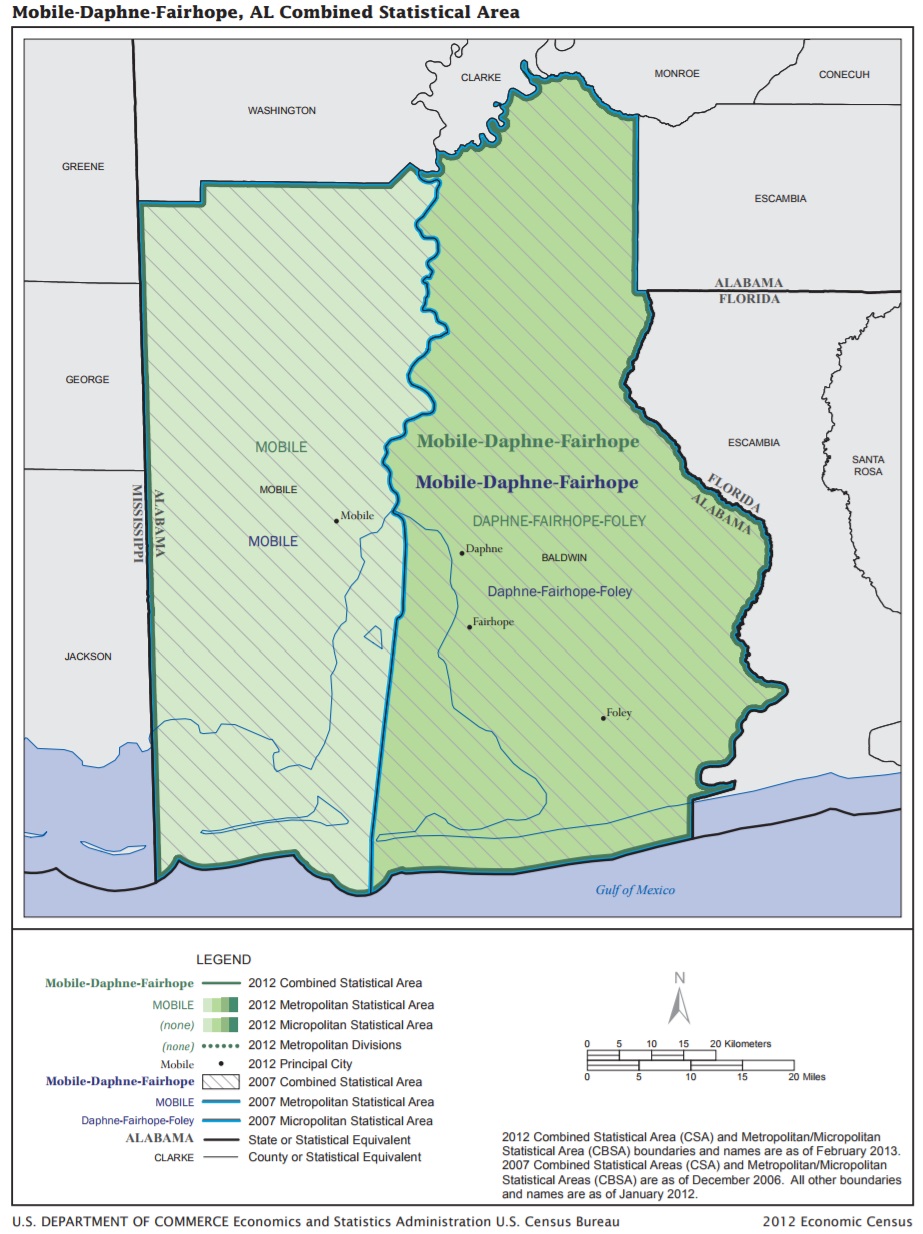
| Mobile-Daphne-Fairhope, AL CSA | 623,399 |
| Reno-Carson City-Fernley, NV CSA | 613,608 |
| Visalia-Porterville-Hanford, CA CSA | 610,222 |
| Augusta-Richmond County, GA-SC Metro Area | 594,919 |
| Fayetteville-Lumberton-Laurinburg, NC CSA | 548,868 |
| Springfield-Branson, MO CSA | 544,712 |
| Lansing-East Lansing-Owosso, MI CSA | 543,653 |
| Savannah-Hinesville-Statesboro, GA CSA | 539,753 |
| Kalamazoo-Battle Creek-Portage, MI CSA | 532,116 |
| Corpus Christi-Kingsville-Alice, TX CSA | 527,969 |
| Fayetteville-Springdale-Rogers, AR-MO Metro Area | 525,032 |
| Pensacola-Ferry Pass, FL-AL CSA | 523,412 |
| Myrtle Beach-Conway, SC-NC CSA | 510,694 |
| Johnson City-Kingsport-Bristol, TN-VA CSA | 507,995 |
| Columbus-Auburn-Opelika, GA-AL CSA | 501,589 |
| Asheville-Brevard, NC CSA | 485,801 |
| Pensacola-Ferry Pass-Brent, FL Metro Area | 485,684 |
| Davenport-Moline, IA-IL CSA | 472,517 |
| Brownsville-Harlingen-Raymondville, TX CSA | 443,945 |
| Cedar Rapids-Iowa City, IA CSA | 436,627 |
| Rockford-Freeport-Rochelle, IL CSA | 436,273 |
| Macon-Bibb County–Warner Robins, GA CSA | 419,210 |
| Peoria-Canton, IL CSA | 411,782 |
| Hickory-Lenoir, NC CSA | 409,262 |
| Tallahassee-Bainbridge, FL-GA CSA | 406,449 |
| Appleton-Oshkosh-Neenah, WI CSA | 403,965 |
| Gulfport-Biloxi-Pascagoula, MS Metro Area | 391,266 |
| Saginaw-Midland-Bay City, MI CSA | 380,535 |
| Montgomery, AL Metro Area | 373,922 |
| Green Bay-Shawano, WI CSA | 363,831 |
| Erie-Meadville, PA CSA | 362,464 |
| Gainesville-Lake City, FL CSA | 350,007 |
| Lincoln-Beatrice, NE CSA | 348,720 |
| Lubbock-Levelland, TX CSA | 338,115 |
| Midland-Odessa, TX CSA | 325,750 |
| Springfield-Jacksonville-Lincoln, IL CSA | 312,181 |
| Wausau-Stevens Point-Wisconsin Rapids, WI CSA | 307,059 |
| Medford-Grants Pass, OR CSA | 302,431 |
| Rocky Mount-Wilson-Roanoke Rapids, NC CSA | 300,750 |
| Amarillo-Borger, TX CSA | 284,853 |
| Longview-Marshall, TX CSA | 283,980 |
| Wilmington, NC Metro Area | 282,573 |
| Tyler-Jacksonville, TX CSA | 276,958 |
| Bloomsburg-Berwick-Sunbury, PA CSA | 263,337 |
| Fargo-Wahpeton, ND-MN CSA | 260,835 |
| Rochester-Austin, MN CSA | 255,047 |
| Harrisonburg-Staunton-Waynesboro, VA CSA | 254,069 |
| Monroe-Ruston-Bastrop, LA CSA | 253,286 |
| Lafayette-West Lafayette-Frankfort, IN CSA | 249,136 |
| Dothan-Enterprise-Ozark, AL CSA | 248,286 |
| Redding-Red Bluff, CA CSA | 242,907 |
| State College-DuBois, PA CSA | 242,060 |
| Idaho Falls-Rexburg-Blackfoot, ID CSA | 239,764 |
| Lake Charles-Jennings, LA CSA | 238,896 |
| Macon-Bibb County, GA Metro Area | 229,182 |
| Columbia-Moberly-Mexico, MO CSA | 227,604 |
| Bloomington-Pontiac, IL CSA | 225,170 |
| Bowling Green-Glasgow, KY CSA | 225,133 |
| Greenville-Washington, NC CSA | 224,746 |
| Lima-Van Wert-Celina, OH CSA | 218,907 |
| Mansfield-Ashland-Bucyrus, OH CSA | 216,842 |
| Pueblo-Cañon City, CO CSA | 212,569 |
| Bloomington-Bedford, IN CSA | 211,854 |
| Eau Claire-Menomonie, WI CSA | 211,318 |
| Johnstown-Somerset, PA CSA | 209,793 |
| Joplin-Miami, MO-OK CSA | 209,496 |
| Bend-Redmond-Prineville, OR CSA | 203,877 |
| New Bern-Morehead City, NC CSA | 195,001 |
| Morgantown-Fairmont, WV CSA | 194,918 |
| Elmira-Corning, NY CSA | 183,262 |
| Sioux City-Vermillion, IA-SD-NE CSA | 183,226 |
| Jonesboro-Paragould, AR CSA | 174,456 |
| Rapid City-Spearfish, SD CSA | 170,942 |
| Williamsport-Lock Haven, PA CSA | 154,481 |
| Ithaca-Cortland, NY CSA | 152,941 |
| Parkersburg-Marietta-Vienna, WV-OH CSA | 152,059 |
| Jackson-Brownsville, TN CSA | 147,380 |
| Cape Girardeau-Sikeston, MO-IL CSA | 136,188 |
| Paducah-Mayfield, KY-IL CSA | 134,325 |
| Manhattan-Junction City, KS CSA | 132,590 |
| Findlay-Tiffin, OH CSA | 131,225 |
| Hot Springs-Malvern, AR CSA | 130,851 |
| Edwards-Glenwood Springs, CO CSA | 130,628 |
| Mankato-New Ulm-North Mankato, MN CSA | 125,347 |
| Victoria-Port Lavaca, TX CSA | 121,949 |
| Rome-Summerville, GA CSA | 121,384 |
| Kokomo-Peru, IN CSA | 118,451 |
| Quincy-Hannibal, IL-MO CSA | 115,830 |
| Moses Lake-Othello, WA CSA | 112,784 |
| Mount Pleasant-Alma, MI CSA | 112,484 |
| Dixon-Sterling, IL CSA | 90,787 |
| Richmond-Connersville, IN CSA | 89,899 |
| Pullman-Moscow, WA-ID CSA | 88,047 |
| DeRidder-Fort Polk South, LA CSA | 87,496 |
| Columbus-West Point, MS CSA | 79,452 |
| Martin-Union City, TN-KY CSA | 70,264 |
| Clovis-Portales, NM CSA | 69,362 |
| Cleveland-Indianola, MS CSA | 59,144 |
| Oskaloosa-Pella, IA CSA | 55,370 |
| Steamboat Springs-Craig, CO CSA | 37,757 |
| Puerto Rico | 3,411,307 |
| Mayagüez-San Germán, PR CSA | 222,317 |
| Ponce-Coamo-Santa Isabel, PR CSA | 389,661 |
| San Juan-Carolina, PR CSA | 2,449,596 |
________
Populations of some of the largest U.S. metropolitan areas by name 2016
| Geography | 2016 Population Estimate |
| Albany-Schenectady, NY CSA | 1,172,299 |
| Albuquerque-Santa Fe-Las Vegas, NM CSA | 1,171,991 |
| Amarillo-Borger, TX CSA | 284,853 |
| Appleton-Oshkosh-Neenah, WI CSA | 403,965 |
| Asheville-Brevard, NC CSA | 485,801 |
| Atlanta–Athens-Clarke County–Sandy Springs, GA CSA | 6,451,262 |
| Augusta-Richmond County, GA-SC Metro Area | 594,919 |
| Austin-Round Rock, TX Metro Area | 2,056,405 |
| Bend-Redmond-Prineville, OR CSA | 203,877 |
| Birmingham-Hoover-Talladega, AL CSA | 1,361,299 |
| Bloomington-Bedford, IN CSA | 211,854 |
| Bloomington-Pontiac, IL CSA | 225,170 |
| Bloomsburg-Berwick-Sunbury, PA CSA | 263,337 |
| Boise City-Mountain Home-Ontario, ID-OR CSA | 770,906 |
| Boston-Worcester-Providence, MA-RI-NH-CT CSA | 8,176,376 |
| Bowling Green-Glasgow, KY CSA | 225,133 |
| Brownsville-Harlingen-Raymondville, TX CSA | 443,945 |
| Buffalo-Cheektowaga, NY CSA | 1,210,481 |
| Cape Coral-Fort Myers-Naples, FL CSA | 1,087,472 |
| Cape Girardeau-Sikeston, MO-IL CSA | 136,188 |
| Cedar Rapids-Iowa City, IA CSA | 436,627 |
| Charleston-Huntington-Ashland, WV-OH-KY CSA | 687,292 |
| Charlotte-Concord, NC-SC CSA | 2,632,249 |
| Chattanooga-Cleveland-Dalton, TN-GA-AL CSA | 954,228 |
| Chicago-Naperville, IL-IN-WI CSA | 9,882,634 |
| Cincinnati-Wilmington-Maysville, OH-KY-IN CSA | 2,224,231 |
| Cleveland-Akron-Canton, OH CSA | 3,483,311 |
| Cleveland-Indianola, MS CSA | 59,144 |
| Clovis-Portales, NM CSA | 69,362 |
| Columbia-Moberly-Mexico, MO CSA | 227,604 |
| Columbia-Orangeburg-Newberry, SC CSA | 943,470 |
| Columbus-Auburn-Opelika, GA-AL CSA | 501,589 |
| Columbus-Marion-Zanesville, OH CSA | 2,443,402 |
| Columbus-West Point, MS CSA | 79,452 |
| Corpus Christi-Kingsville-Alice, TX CSA | 527,969 |
| Dallas-Fort Worth, TX-OK CSA | 7,673,305 |
| Davenport-Moline, IA-IL CSA | 472,517 |
| Dayton-Springfield-Sidney, OH CSA | 1,074,617 |
| Denver-Aurora, CO CSA | 3,470,235 |
| DeRidder-Fort Polk South, LA CSA | 87,496 |
| Des Moines-Ames-West Des Moines, IA CSA | 795,055 |
| Detroit-Warren-Ann Arbor, MI CSA | 5,318,653 |
| Dixon-Sterling, IL CSA | 90,787 |
| Dothan-Enterprise-Ozark, AL CSA | 248,286 |
| Eau Claire-Menomonie, WI CSA | 211,318 |
| Edwards-Glenwood Springs, CO CSA | 130,628 |
| El Paso-Las Cruces, TX-NM CSA | 1,056,178 |
| Elmira-Corning, NY CSA | 183,262 |
| Erie-Meadville, PA CSA | 362,464 |
| Fargo-Wahpeton, ND-MN CSA | 260,835 |
| Fayetteville-Lumberton-Laurinburg, NC CSA | 548,868 |
| Fayetteville-Springdale-Rogers, AR-MO Metro Area | 525,032 |
| Findlay-Tiffin, OH CSA | 131,225 |
| Fort Wayne-Huntington-Auburn, IN CSA | 627,934 |
| Fresno-Madera, CA CSA | 1,134,612 |
| Gainesville-Lake City, FL CSA | 350,007 |
| Grand Rapids-Wyoming-Muskegon, MI CSA | 1,443,508 |
| Green Bay-Shawano, WI CSA | 363,831 |
| Greensboro–Winston-Salem–High Point, NC CSA | 1,650,019 |
| Greenville-Spartanburg-Anderson, SC CSA | 1,442,117 |
| Greenville-Washington, NC CSA | 224,746 |
| Gulfport-Biloxi-Pascagoula, MS Metro Area | 391,266 |
| Harrisburg-York-Lebanon, PA CSA | 1,252,820 |
| Harrisonburg-Staunton-Waynesboro, VA CSA | 254,069 |
| Hartford-West Hartford, CT CSA | 1,476,637 |
| Hickory-Lenoir, NC CSA | 409,262 |
| Honolulu, HI MSA | 992,605 |
| Hot Springs-Malvern, AR CSA | 130,851 |
| Houston-The Woodlands, TX CSA | 6,972,374 |
| Huntsville-Decatur-Albertville, AL CSA | 768,033 |
| Idaho Falls-Rexburg-Blackfoot, ID CSA | 239,764 |
| Indianapolis-Carmel-Muncie, IN CSA | 2,386,199 |
| Ithaca-Cortland, NY CSA | 152,941 |
| Jackson-Brownsville, TN CSA | 147,380 |
| Jackson-Vicksburg-Brookhaven, MS CSA | 670,031 |
| Jacksonville-St. Marys-Palatka, FL-GA CSA | 1,603,497 |
| Johnson City-Kingsport-Bristol, TN-VA CSA | 507,995 |
| Johnstown-Somerset, PA CSA | 209,793 |
| Jonesboro-Paragould, AR CSA | 174,456 |
| Joplin-Miami, MO-OK CSA | 209,496 |
| Kalamazoo-Battle Creek-Portage, MI CSA | 532,116 |
| Kansas City-Overland Park-Kansas City, MO-KS CSA | 2,446,396 |
| Knoxville-Morristown-Sevierville, TN CSA | 1,117,758 |
| Kokomo-Peru, IN CSA | 118,451 |
| Lafayette-Opelousas-Morgan City, LA CSA | 627,504 |
| Lafayette-West Lafayette-Frankfort, IN CSA | 249,136 |
| Lake Charles-Jennings, LA CSA | 238,896 |
| Lansing-East Lansing-Owosso, MI CSA | 543,653 |
| Las Vegas-Henderson, NV-AZ CSA | 2,404,336 |
| Lexington-Fayette–Richmond–Frankfort, KY CSA | 732,372 |
| Lima-Van Wert-Celina, OH CSA | 218,907 |
| Lincoln-Beatrice, NE CSA | 348,720 |
| Little Rock-North Little Rock, AR CSA | 905,847 |
| Longview-Marshall, TX CSA | 283,980 |
| Los Angeles-Long Beach, CA CSA | 18,688,022 |
| Louisville/Jefferson County–Elizabethtown–Madison, KY-IN CSA | 1,510,945 |
| Lubbock-Levelland, TX CSA | 338,115 |
| Macon-Bibb County, GA Metro Area | 229,182 |
| Macon-Bibb County–Warner Robins, GA CSA | 419,210 |
| Madison-Janesville-Beloit, WI CSA | 874,498 |
| Manhattan-Junction City, KS CSA | 132,590 |
| Mankato-New Ulm-North Mankato, MN CSA | 125,347 |
| Mansfield-Ashland-Bucyrus, OH CSA | 216,842 |
| Martin-Union City, TN-KY CSA | 70,264 |
| McAllen-Edinburg, TX CSA | 913,965 |
| Medford-Grants Pass, OR CSA | 302,431 |
| Memphis-Forrest City, TN-MS-AR CSA | 1,369,038 |
| Miami-Fort Lauderdale-Port St. Lucie, FL CSA | 6,723,472 |
| Midland-Odessa, TX CSA | 325,750 |
| Milwaukee-Racine-Waukesha, WI CSA | 2,043,274 |
| Minneapolis-St. Paul, MN-WI CSA | 3,894,820 |
| Mobile-Daphne-Fairhope, AL CSA | 623,399 |
| Modesto-Merced, CA CSA | 810,232 |
| Monroe-Ruston-Bastrop, LA CSA | 253,286 |
| Montgomery, AL Metro Area | 373,922 |
| Morgantown-Fairmont, WV CSA | 194,918 |
| Moses Lake-Othello, WA CSA | 112,784 |
| Mount Pleasant-Alma, MI CSA | 112,484 |
| Myrtle Beach-Conway, SC-NC CSA | 510,694 |
| Nashville-Davidson–Murfreesboro, TN CSA | 1,987,778 |
| New Bern-Morehead City, NC CSA | 195,001 |
| New Orleans-Metairie-Hammond, LA-MS CSA | 1,501,213 |
| New York-Newark, NY-NJ-CT-PA CSA | 23,689,255 |
| North Port-Sarasota, FL CSA | 1,002,722 |
| Oklahoma City-Shawnee, OK CSA | 1,445,501 |
| Omaha-Council Bluffs-Fremont, NE-IA CSA | 960,886 |
| Orlando-Deltona-Daytona Beach, FL CSA | 3,202,927 |
| Oskaloosa-Pella, IA CSA | 55,370 |
| Paducah-Mayfield, KY-IL CSA | 134,325 |
| Parkersburg-Marietta-Vienna, WV-OH CSA | 152,059 |
| Pensacola-Ferry Pass, FL-AL CSA | 523,412 |
| Pensacola-Ferry Pass-Brent, FL Metro Area | 485,684 |
| Peoria-Canton, IL CSA | 411,782 |
| Philadelphia-Reading-Camden, PA-NJ-DE-MD CSA | 7,179,357 |
| Phoenix-Mesa-Scottsdale, AZ Metro Area | 4,661,537 |
| Pittsburgh-New Castle-Weirton, PA-OH-WV CSA | 2,635,228 |
| Portland-Lewiston-South Portland, ME CSA | 636,976 |
| Portland-Vancouver-Salem, OR-WA CSA | 3,160,488 |
| Pueblo-Cañon City, CO CSA | 212,569 |
| Pullman-Moscow, WA-ID CSA | 88,047 |
| Quincy-Hannibal, IL-MO CSA | 115,830 |
| Raleigh-Durham-Chapel Hill, NC CSA | 2,156,253 |
| Rapid City-Spearfish, SD CSA | 170,942 |
| Redding-Red Bluff, CA CSA | 242,907 |
| Reno-Carson City-Fernley, NV CSA | 613,608 |
| Richmond-Connersville, IN CSA | 89,899 |
| Richmond-Petersburg, VA Metro Area | 1,281,708 |
| Rochester-Austin, MN CSA | 255,047 |
| Rochester-Batavia-Seneca Falls, NY CSA | 1,172,138 |
| Rockford-Freeport-Rochelle, IL CSA | 436,273 |
| Rocky Mount-Wilson-Roanoke Rapids, NC CSA | 300,750 |
| Rome-Summerville, GA CSA | 121,384 |
| Sacramento-Roseville, CA CSA | 2,567,451 |
| Saginaw-Midland-Bay City, MI CSA | 380,535 |
| Salt Lake City-Provo-Orem, UT CSA | 2,514,748 |
| San Antonio-New Braunfels, TX Metro Area | 2,429,609 |
| San Diego-Carlsbad, CA Metro Area | 3,317,749 |
| San Jose-San Francisco-Oakland, CA CSA | 8,751,807 |
| Savannah-Hinesville-Statesboro, GA CSA | 539,753 |
| Seattle-Tacoma, WA CSA | 4,684,516 |
| Sioux City-Vermillion, IA-SD-NE CSA | 183,226 |
| South Bend-Elkhart-Mishawaka, IN-MI CSA | 725,087 |
| Spokane-Spokane Valley-Coeur d’Alene, WA-ID CSA | 710,945 |
| Springfield-Branson, MO CSA | 544,712 |
| Springfield-Greenfield Town, MA CSA | 700,665 |
| Springfield-Jacksonville-Lincoln, IL CSA | 312,181 |
| St. Louis-St. Charles-Farmington, MO-IL CSA | 2,911,769 |
| State College-DuBois, PA CSA | 242,060 |
| Steamboat Springs-Craig, CO CSA | 37,757 |
| Syracuse-Auburn, NY CSA | 734,371 |
| Tallahassee-Bainbridge, FL-GA CSA | 406,449 |
| Tampa-St. Petersburg-Clearwater, FL Metro Area | 3,032,171 |
| Toledo-Port Clinton, OH CSA | 645,857 |
| Tucson-Nogales, AZ CSA | 1,062,191 |
| Tulsa-Muskogee-Bartlesville, OK CSA | 1,157,465 |
| Tyler-Jacksonville, TX CSA | 276,958 |
| Victoria-Port Lavaca, TX CSA | 121,949 |
| Virginia Beach-Norfolk, VA-NC CSA | 1,830,629 |
| Visalia-Porterville-Hanford, CA CSA | 610,222 |
| Washington-Baltimore-Arlington, DC-MD-VA-WV-PA CSA | 9,665,892 |
| Wausau-Stevens Point-Wisconsin Rapids, WI CSA | 307,059 |
| Wichita-Arkansas City-Winfield, KS CSA | 680,425 |
| Williamsport-Lock Haven, PA CSA | 154,481 |
| Wilmington, NC Metro Area | 282,573 |
| Youngstown-Warren, OH-PA CSA | 648,431 |
________
_____
Some of the most populous counties by their 2015 populations
ALABAMA
Jefferson 659,521
Mobile 414,836
Madison 356,967
Montgomery 226,349
Shelby 210,622
Tuscaloosa 206,102
Baldwin 208,563
ALASKA
Anchorage Municipality 298,192
Fairbanks North Star Borough 100,605
Matanuska-Susitna Borough 104,365
ARIZONA
Maricopa 4,242,997
Pima 1,016,206
Pinal 418,540
ARKANSAS
Pulaski 393,250
Benton 258,291
Washington 228,049
CALIFORNIA
Los Angeles 10,137,915
San Diego 3,317,749
Orange 3,172,532
Riverside 2,387,741
San Bernardino 2,140,096
Santa Clara 1,919,402
Alameda 1,647,704
Sacramento 1,514,460
Contra Costa 1,135,127
Fresno 979,915
COLORADO
Denver 693,060
El Paso 688,284
Arapahoe 637,068
Jefferson 571,837
Adams 498,187
Larimer 339,993
Douglas 328,632
Boulder 322,226
CONNECTICUT
Fairfield 944,177
Hartford 892,389
New Haven 856,875
DELAWARE
New Castle 556,987
DISTRICT OF COLUMBIA
Washington 681,170
FLORIDA
Miami-Dade 2,712,945
Broward 1,909,632
Palm Beach 1,443,810
Hillsborough 1,376,238
Orange 1,314,367
Pinellas 960,730
Duval 926,255
Lee 722,336
Polk 666,149
GEORGIA
Fulton 1,023,336
Gwinnett 907,135
Cobb 748,150
DeKalb 740,321
Chatham 289,082
Clayton 279,462
Cherokee 241,689
Henry 221,768
Forsyth 221,009
Richmond 201,647
Muscogee 197,485
HAWAII
Honolulu 992,605
IDAHO
Ada 444,028
Canyon 211,698
Kootenai 154,311
Bonneville 112,232
ILLINOIS
Cook 5,203,499
DuPage 929,368
Lake 703,047
Will 689,529
Kane 531,715
INDIANA
Marion 941,229
Lake 485,846
Allen 370,404
Hamilton 316,373
IOWA
Polk 474,045
Linn 221,661
Scott 172,474
Johnson 146,547
Black Hawk 132,904
Woodbury 102,779
KANSAS
Johnson 584,451
Sedgwick 511,995
Shawnee 178,146
Wyandotte 163,831
Douglas 119,440
KENTUCKY
Jefferson 765,352
Fayette 318,449
Kenton 164,945
LOUISIANA
East Baton Rouge 447,037
Jefferson 436,523
Orleans 391,495
Caddo 248,851
St. Tammany 253,602
Lafayette 241,398
MAINE
Cumberland 292,041
York 202,343
MARYLAND
Montgomery 1,043,863
Baltimore County (excluding Baltimore City) 831,026
Baltimore City 614,664
Anne Arundel 568,346
MASSACHUSETTS
Middlesex 1,589,774
Worcester 819,589
Suffolk 784,230
Essex 779,018
MICHIGAN
Wayne 1,749,366
Oakland 1,243,970
Macomb 867,730
Kent 642,173
Genesee 408,615
MINNESOTA
Hennepin 1,232,483
Ramsey 540,649
Dakota 417,486
Anoka 345,957
MISSISSIPPI
Hinds 241,229
Harrison 203,234
DeSoto 175,611
Rankin 150,228
Jackson 141,241
MISSOURI
St. Louis (not including City of St. Louis) 998,581
Jackson 691,801
St. Charles 390,918
St. Louis city 311,404
Greene 288,690
Clay 239,085
Jefferson 224,226
MONTANA
Yellowstone 158,437
Missoula 116,130
NEBRASKA
Douglas 554,995
Lancaster 309,637
Sarpy 179,023
NEVADA
Clark 2,155,664
Washoe 453,616
NEW HAMPSHIRE
Hillsborough 407,761
Rockingham 303,251
Merrimack 148,582
NEW JERSEY
Bergen 939,151
Middlesex 837,073
Essex 796,914
NEW MEXICO
Bernalillo 676,953
Doña Ana 214,207
Santa Fe 148,651
Sandoval 142,025
San Juan 115,079
NEW YORK
Kings 2,629,150
Queens 2,333,054
New York 1,643,734
Suffolk 1,492,583
Bronx 1,455,720
Nassau 1,361,500
Westchester 974,542
Erie 921,046
Monroe 747,727
Richmond 476,015
Onondaga 466,194
NORTH CAROLINA
Mecklenburg 1,054,835
Wake 1,046,791
Guilford 521,330
Forsyth 371,511
Cumberland 327,127
Durham 306,212
Buncombe 256,088
Union 226,606
New Hanover 223,483
Gaston 216,965
NORTH DAKOTA
Cass 175,249
Burleigh 94,487
Grand Forks 71,083
Ward 70,210
OHIO
Cuyahoga 1,249,352
Franklin 1,264,518
Hamilton 809,099
Summit 540,300
Montgomery 531,239
Lucas 432,488
Stark 373,612
Butler 377,537
Lorain 432,488
OKLAHOMA
Oklahoma 782,970
Tulsa 642,940
Cleveland 278,655
OREGON
Multnomah 799,766
Washington 582,779
Clackamas 408,062
Lane 369,519
Marion 336,316
PENNSYLVANIA
Philadelphia (and the City of Philadelphia) 1,567,872
Allegheny 1,225,365
Montgomery 821,725
Bucks 626,399
Delaware 563,402
Lancaster 538,500
Chester 516,312
York 443,744
Berks 414,812
RHODE ISLAND
Providence 633,673
SOUTH CAROLINA
Greenville 498,766
Charleston 396,484
Horry 322,342
Spartanburg 301,463
Lexington 286,196
York 258,526
Berkeley 210,898
Anderson 196,569
SOUTH DAKOTA
Minnehaha 187,318
Pennington 109,372
TENNESSEE
Shelby 934,603
Davidson 684,410
Knox 456,132
Hamilton 357,738
Rutherford 308,251
TEXAS
Harris 4,589,928
Dallas 2,574,984
Tarrant 2,016,872
Bexar 1,928,680
Travis 1,199,323
Collin 939,585
El Paso 837,918
Hidalgo 849,843
Denton 806,180
Fort Bend 741,237
UTAH
Salt Lake 1,121,354
Utah 592,299
Davis 342,281
VERMONT
Chittenden 161,531
VIRGINIA
Fairfax 1,138,652
Virginia Beach city 452,602
Prince William 455,210
Loudoun 385,945
Chesterfield 339,009
Henrico 326,501
Norfolk city 245,115
Chesapeake city 237,940
Arlington 230,050
Richmond city 223,170
WASHINGTON
King 2,149,970
Pierce 861,312
Snohomish 787,620
Spokane 499,072
Clark 467,018
WEST VIRGINIA
Kanawha 186,241
Berkeley 113,525
Monongalia 104,622
WISCONSIN
Milwaukee 951,448
Dane 531,273
Waukesha 398,424
Brown 260,401
WYOMING
Laramie 98,136
Natrona 81,039
Metro maps showing counties that comprise some of the Combined Statistical Areas (CSA)


______
U.S. Census Bureau metropolitan population estimates –Release Date: March 24, 2016
U.S. Census Bureau metropolitan population estimates –Release Date: March 24, 2016


March 23, 2017
Business, Did you know?